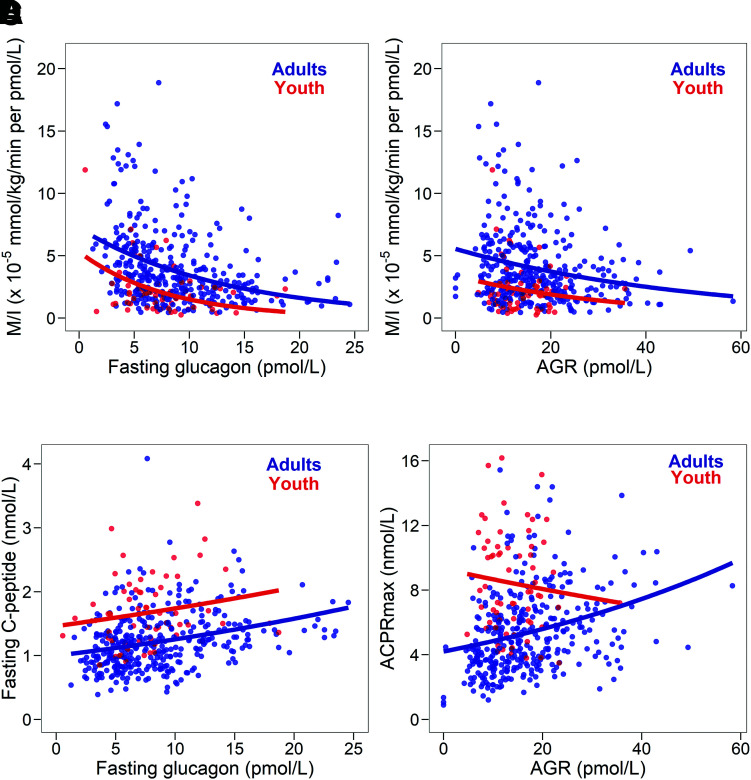
Figure 3.
Relationship of fasting glucagon and insulin sensitivity (M/I) (A), the AGR and M/I (B), fasting glucagon and fasting C-peptide (C), and AGR and ACPRmax (D) in 66 youth (in red) and 350 adults (in blue). The correlation of fasting glucagon with M/I was similar in youth (r = −0.228, P = 0.066) and adults (r = −0.324, P < 0.001); the slopes did not differ between youth and adults (Pinteraction = 0.944), while the intercepts did (P < 0.001). The correlation of AGR with M/I was significant in adults (r = −0.222, P < 0.001) but not in youth (r = −0.069, P = 0.588); again, the slopes were not significantly different in youth and adults (Pinteraction = 0.680), but the intercepts differed (P < 0.001). The relation of fasting glucagon to fasting C-peptide was similar in adults (r = 0.335, P < 0.001) and youth (r = 0.209, P = 0.091), with no significant difference in the slopes in youth and adults (Pinteraction = 0.514) and a significant difference in the intercepts (P < 0.001). The correlation of AGR and ACPRmax was significant in adults (r = 0.355, P < 0.001), but not in youth (r = −0.101, P = 0.423), with the interaction of the slopes being significant (P = 0.014).

