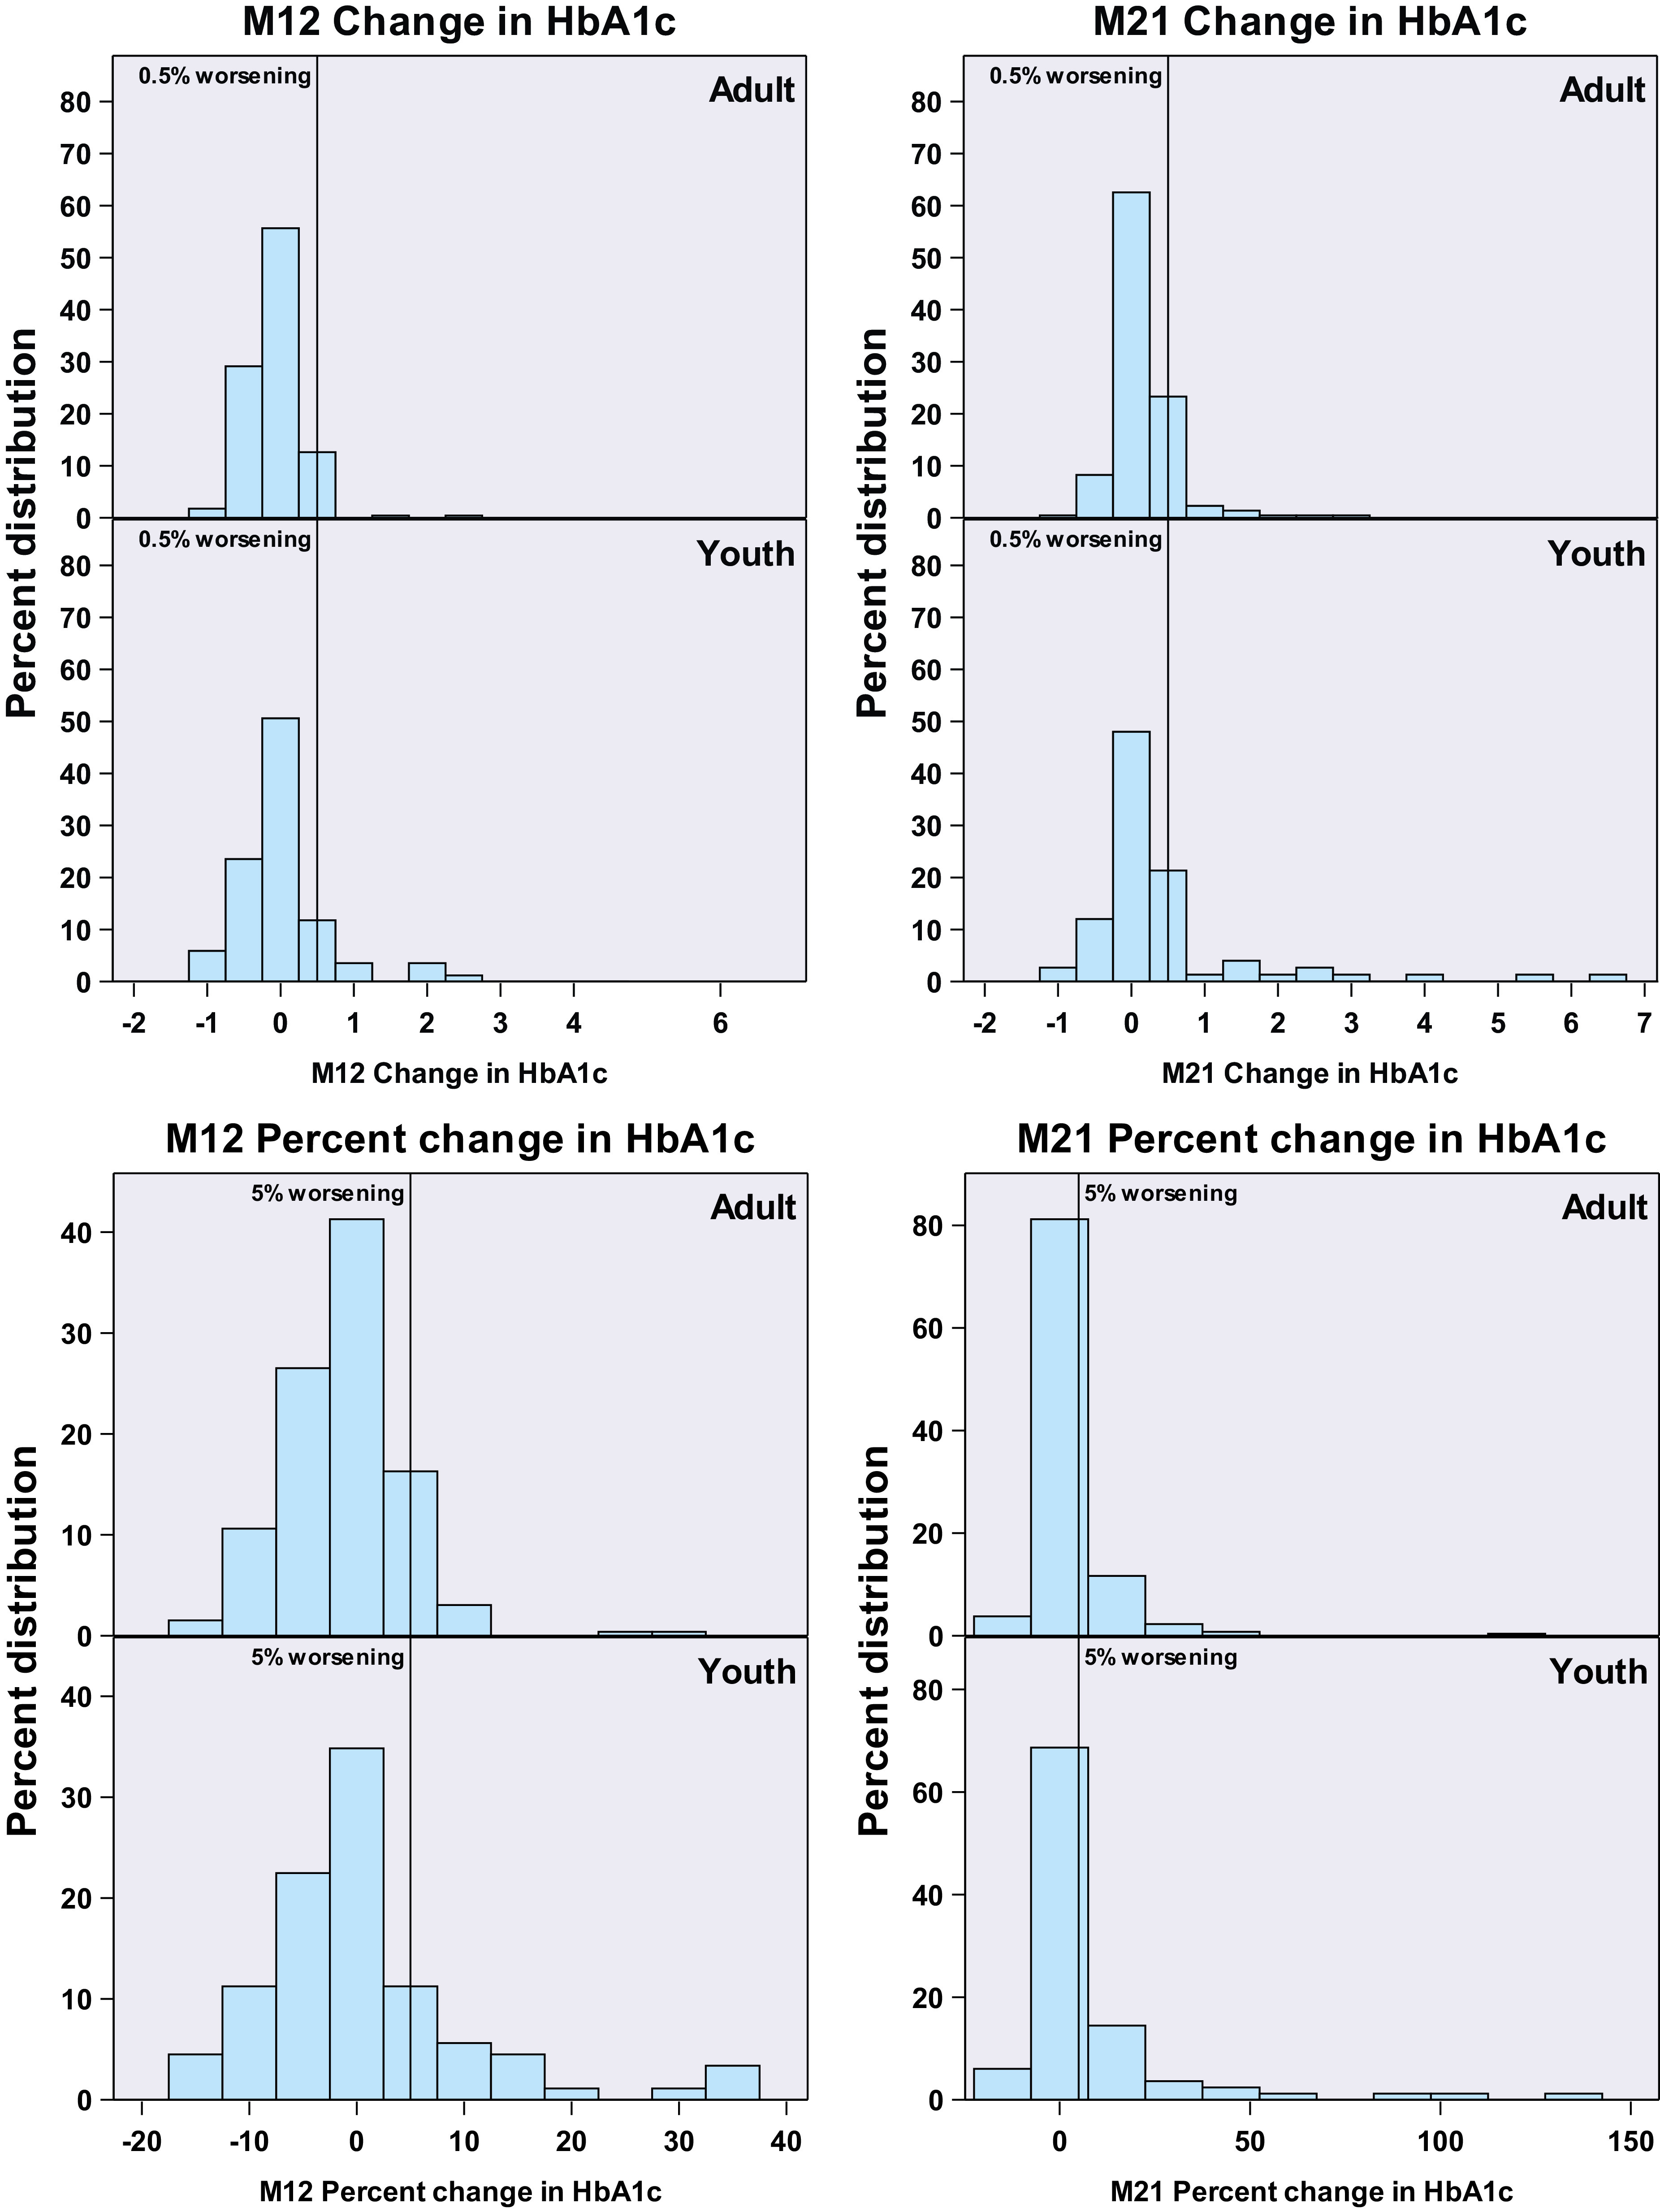
Figure 1.

Change from baseline in glycemia at M12 (on treatment) and M21 (9 months after treatment withdrawal). Top panel: Glycemic worsening based on absolute increase in HbA1c in adults and youth from baseline to M12 (left panel) and M21 (right panel). The vertical lines depict 0.5% worsening in absolute HbA1c. On the left, there are no significant differences between adults and youth at M12. On the right, youth experienced greater glycemic worsening at M21 (P = 0.041). Bottom panel: Glycemic worsening based on the percentage (relative) increase in HbA1c in adults and youth from baseline to M12 (left panel) and M21 (right panel). The vertical lines are shown at 5% worsening. Youth experienced greater glycemic worsening when defined as the percentage increase in HbA1c at M12 (P < 0.001) and at M21 (P < 0.001).
