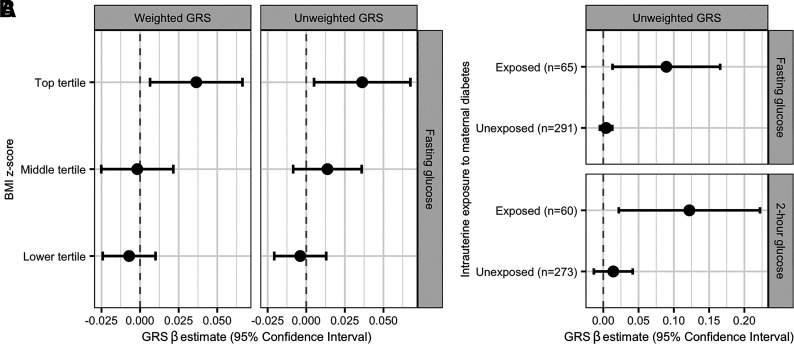
Figure 3.
Interactions with T2D GRS in relation to glucose levels. A: This plot shows the β estimates and CIs from linear regression models of log-transformed fasting glucose as a function of a weighted (left) and unweighted (right) T2D GRS stratified by tertile of BMI z score. Models controlled for age, sex, exposure to in utero maternal diabetes, and five genetic PCs. β estimates are reported per SD increase in GRS. B: This plot shows the β estimates and CIs from linear regression models of log-transformed fasting glucose and 2-h glucose as a function of an unweighted T2D GRS among youth exposed and unexposed in utero to maternal diabetes. Models controlled for age, sex, BMI z score, and five genetic PCs. β estimates are reported per SD increase in GRS.

