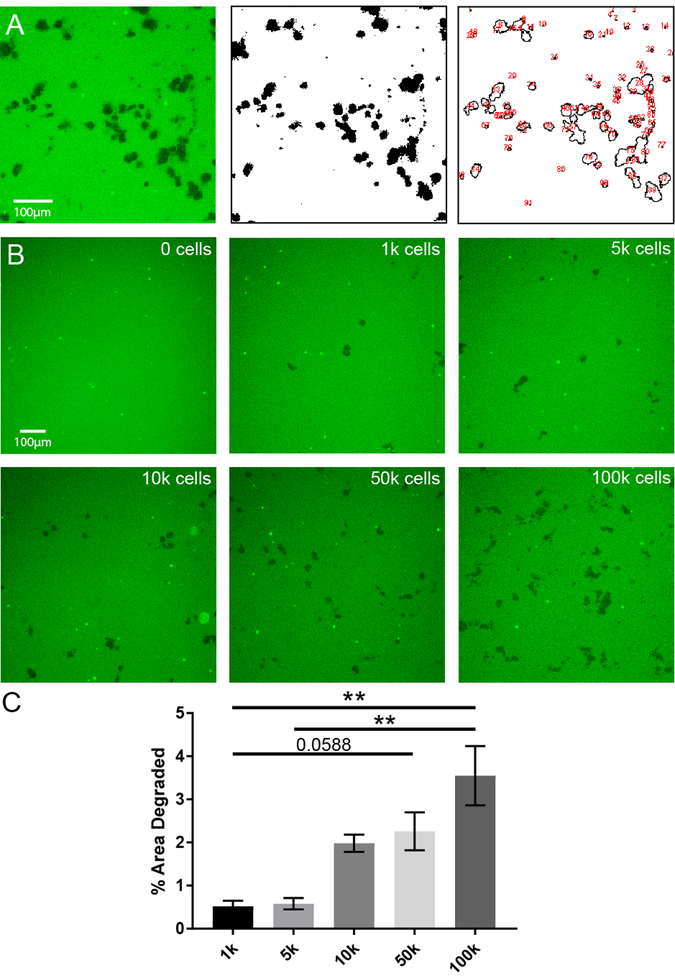
Figure 2. Quantification of fibrinogen degradation by eosinophils.
A) Original image used for quantification using ImageJ (left), thresholded version of image within ImageJ (middle), and quantification view of the image within ImageJ (right). Black outlines demarcate areas where degradation occurred, red numbers quantify number of areas of degradation. B) Fibrinogen substrate (green) exposed to increasing numbers of eosinophils. Images are representative of at least two independent experiments. C) Quantification of images from part B using ImageJ strategy from A. **p<0.01 by Kruskal-Wallis. Fields from three replicates were counted per condition from two independent experiments.

