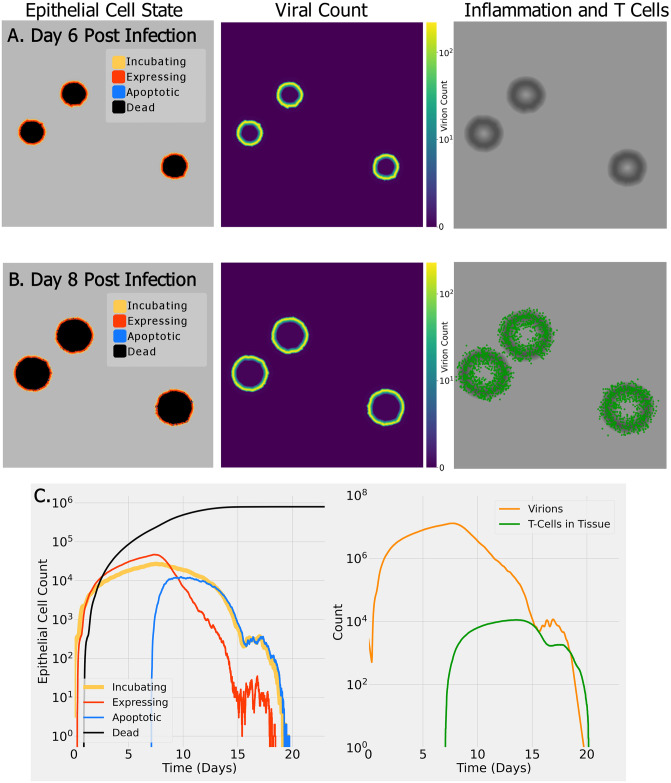
Fig 2. Example SIMCoV simulation on a small 15 x 15 mm2 layer of epithelial tissue.
(A) six days post infection (dpi); (B) eight dpi. Color indicates epithelial cell state (see legend, left column), virus concentration (see scale bar, middle column), and presence of inflammatory signal (in grayscale with darker regions having a stronger signal, right column) and T cells (green); (C) (left panel) shows the dynamics of epithelial cell state, and (right panel) shows virus and T cell dynamics. A video of this simulation can be viewed at https://youtu.be/e3fqe52--2k.

