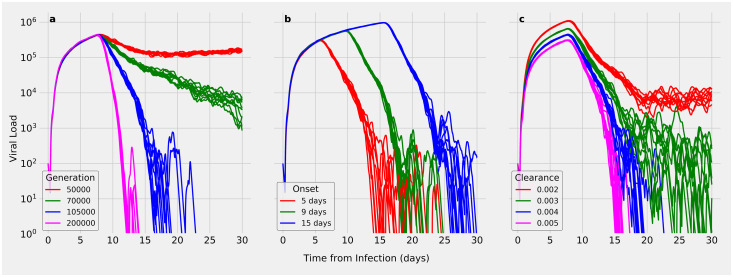
Fig 4. Effect of varying key immune response simulation parameters.
Each subplot varies one parameter while holding others at the default values (Table 2) and shows the results of 10 random runs. (A) Varying T cell generation rate from 50,000 to 200,000 T cells produced per minute; (B) varying T cell delay; (C) varying viral clearance rate.

