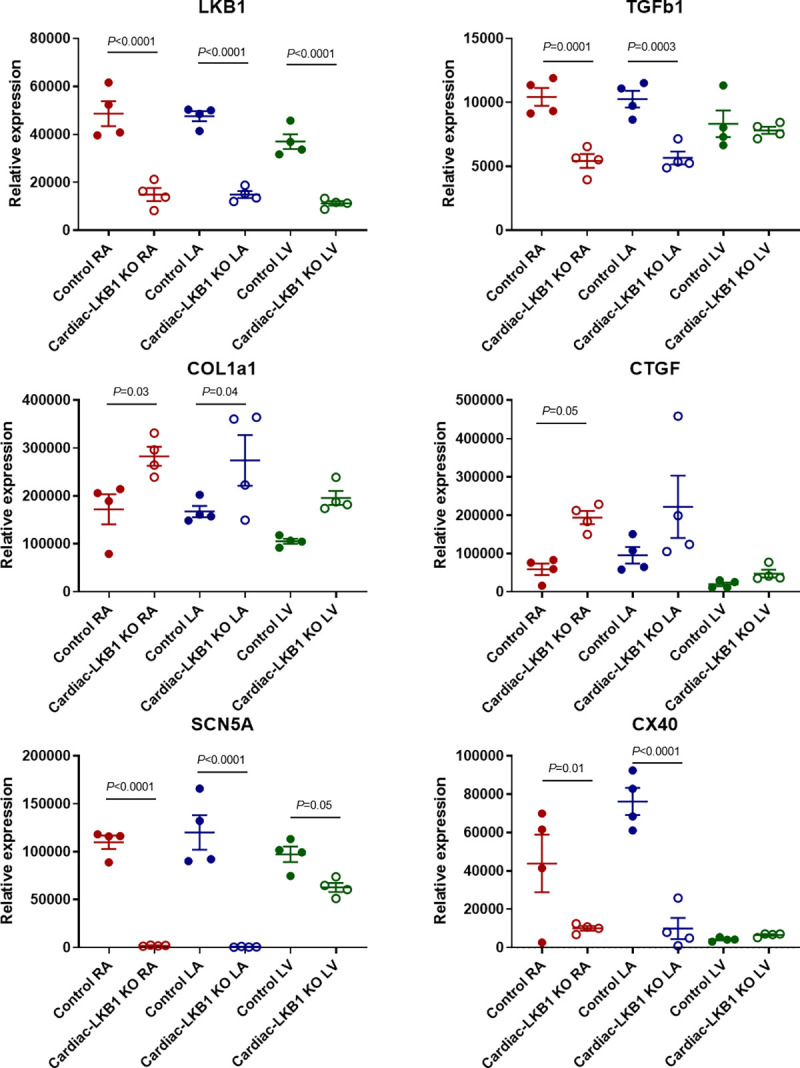
Fig 6. mRNA expression level in right atria, left atria and left ventricles of Cardiac-LKB1 KO and control mice.

mRNA expression quantification for LKB1, TGFβ1 (transforming growth factor β1), COL1a1 (collagen type 1 α1), CTGF (connective tissue growth factor), SCN5a (voltage gated sodium channel α subunit 5) and CX40 (connexin 40). Each point indicates individual animal data, and lines represent mean ± SEM.
