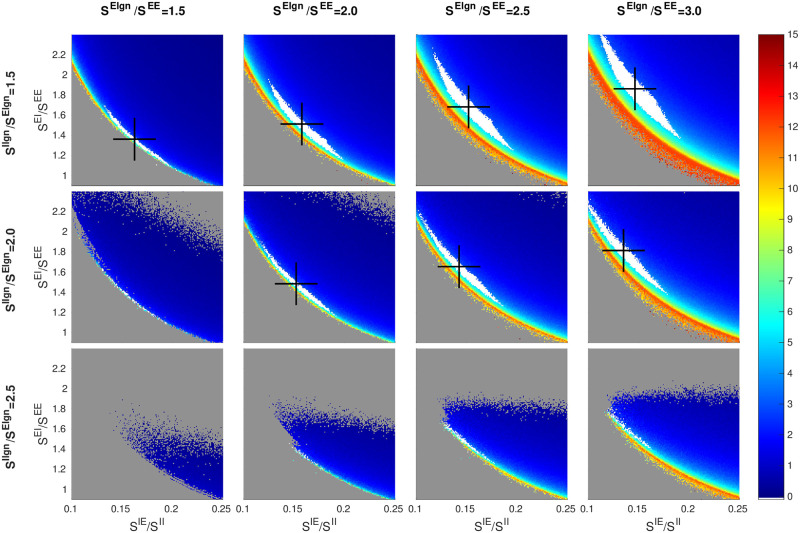
Fig 2. Dependence of firing rate and good area on LGN synaptic strengths.
A 3 × 4 matrix of panels is shown: each row corresponds to a fixed value of SIlgn/Elgn and each column a fixed value of SElgn/SEE. Each panel shows a heat map for fE on an inhibition plane (color bar on the right); x and y-axes are as in Fig 1. Good areas are in white, and their centers of mass marked by black crosses. The picture for SElgn/SEE = 2 and SIlgn/Elgn = 2 (row 2, column 2) corresponds to the fE rate map in Fig 1. Other free parameters are SEE = 0.024, SII = 0.12, and FIL6 = 3 × FEL6.

