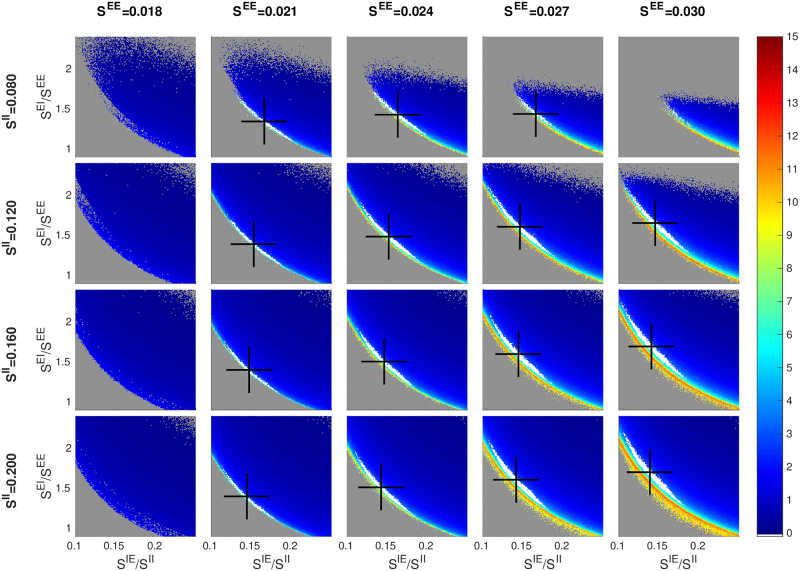
Fig 4. Dependence of firing rate and good area on SEE and SII.
Smaller panels are as in Figs 2 and 3, with good areas (where visible) in white and black crosses denoting their centers of mass. The picture for SEE = 0.024 and SII = 0.120 (row 2, column 3) corresponds to the fE rate map in Fig 1. Other free parameters are SElgn = 2 × SEE, SIlgn = 2 × SElgn, and FIL6 = 3 × FEL6.

