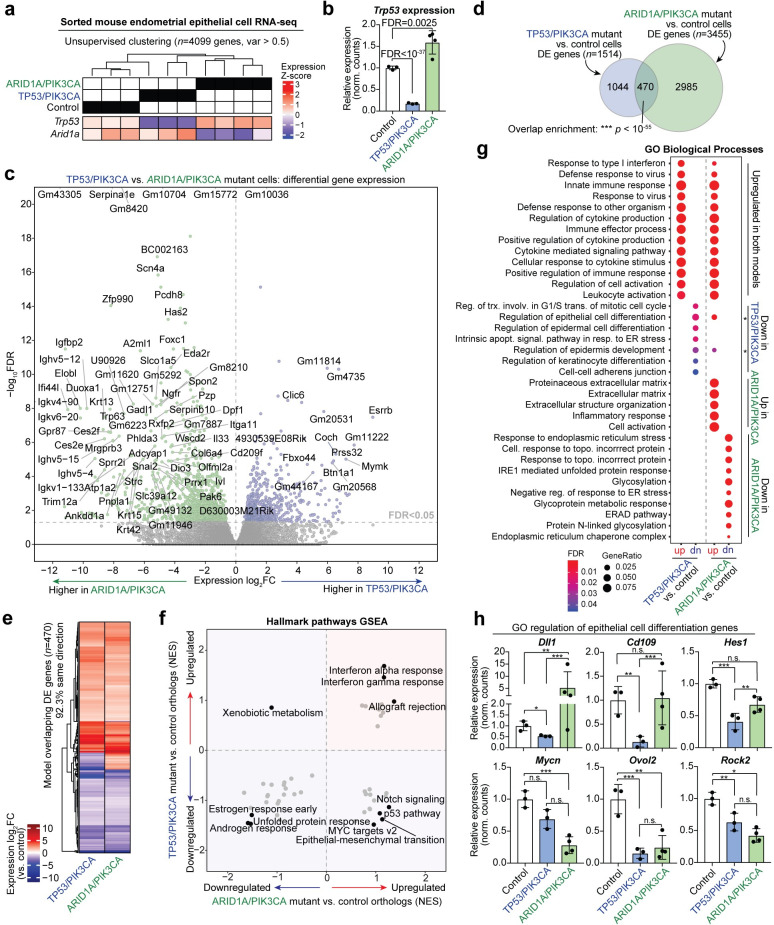
Fig 3. Endometrial epithelial TP53 and ARID1A loss results in overlapping and distinct gene expression programs.
a, Unsupervised hierarchical clustering of gene-level RNA-seq data from sorted endometrial epithelial cells of TP53/PIK3CA mutant mice compared to ARID1A/PIK3CA mutant and control cells. Relative Z-score expression of targeted genes are displayed below clustering result. b, Relative linear Trp53 expression in endometrial epithelial cell transcriptomes. c, Volcano plot depicting differential gene expression between TP53/PIK3CA mutant and ARID1A/PIK3CA mutant cells. d, Overlap of DE genes between TP53/PIK3CA mutants and ARID1A/PIK3CA mutant cells vs. controls. Statistic is hypergeometric enrichment. e, Heatmap of 470 shared dysregulated genes in endometrial epithelial cells from each genetic model. 92.3% of intersecting DE genes are affected in the same direction. f, Overview of Broad GSEA results for MSigDB Hallmark pathways in endometrial epithelial cells from each genetic model. Axes display gene set normalized enrichment score (NES) for each model compared to control cells. g, Enrichment for Gene Ontology (GO) Biological Process gene sets among genetic model DE genes separated by directionality. h, Examples of DE genes within the GO regulation of epithelial cell differentiation gene set: DLL1, CD109, HES1, MYCN, OVOL2, ROCK2. Statistic is FDR as reported by DESeq2: * FDR < 0.05; ** FDR < 0.01; *** FDR < 0.001.

