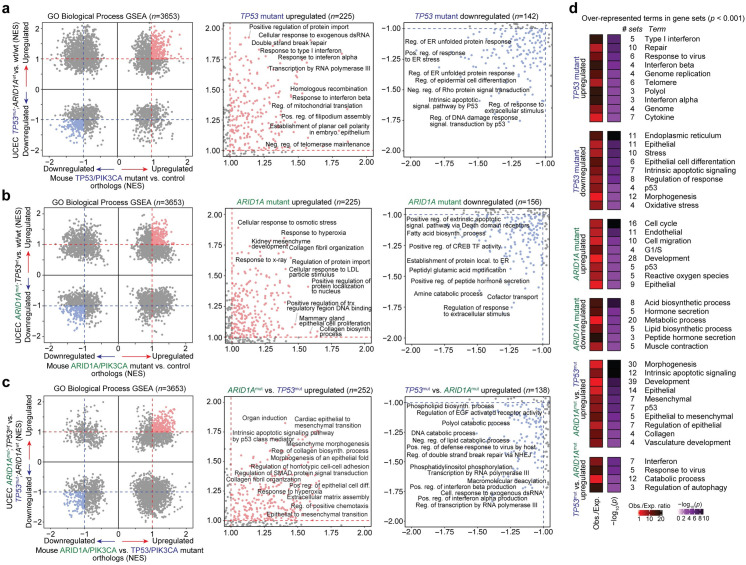
Fig 4. Pathway analysis of TP53 and ARID1A regulated expression programs in human disease and mouse models.
a-c, Various Broad GSEA results for GO Biological Process gene sets (n = 3653) comparing TP53 and ARID1A mutant human UCEC tumors and genetically engineered mouse models: (a) TP53 mutant, ARID1A wild-type vs. wild-type/wild-type UCEC tumors compared to mouse endometrial epithelial cells from TP53/PIK3CA mutants vs. controls; (b) ARID1A mutant, TP53 wild-type vs. wild-type/wild-type UCEC tumors compared to mouse endometrial epithelial cells from ARID1A/PIK3CA mutants vs. controls; (c) ARID1A mutant, TP53 wild-type vs. TP53 mutant, ARID1A wild-type UCEC tumors compared to mouse endometrial epithelial cells from ARID1A/PIK3CA mutants vs. TP53/PIK3CA mutants. Presented are the overview of GSEA results (left) with zooms into shared upregulated (NES > 1, center) and shared downregulated (NES < -1, right) gene sets. Representative examples of highly enriched gene sets are labeled. d, Significantly over-represented terms in enriched gene sets (|NES| > 1) highlighted in a-c. Statistic is hypergeometric enrichment. See Materials and Methods for enrichment analysis framework.

