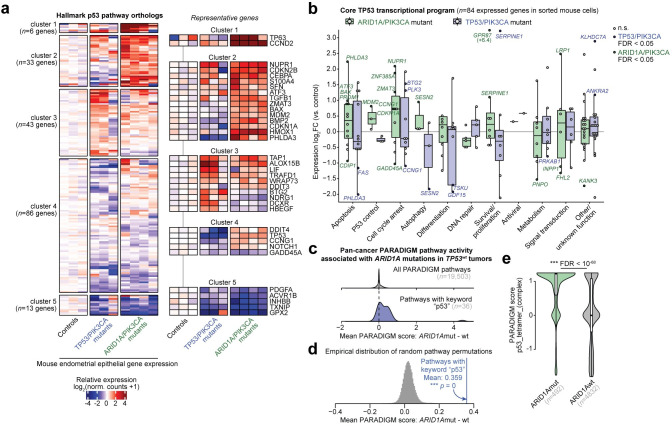
Fig 5. ARID1A mutation is associated with p53 pathway activation.
a, k-means clustering and heatmap of genetic mouse model RNA-seq relative log2 gene expression data for MSigDB Hallmark p53 pathway genes (n = 181 expressed orthologs). Representative genes are highlighted on the right. b, Differential expression of core TP53 transcriptional program gene orthologs, segregated by function, in mouse endometrial epithelial cells from ARID1A/PIK3CA mutants (green) and TP53/PIK3CA mutants (blue) compared to controls. Significant DE genes (FDR < 0.05) in each model are labeled and respectively colored. c, Distribution of PARADIGM score differences between ARID1A mutant (n = 492) vs. wild-type (n = 4832) TCGA Pan-Cancer Atlas tumors, considerate of only TP53 wild-type tumors. Top, all 19,503 measured pathways; bottom, the 36 pathways with keyword “p53”. d, Empirical distribution of mean differences between ARID1A mutant vs. wild-type PARADIGM scores, based on 50,000 samples of 36 random PARADIGM pathways. The blue line represents the mean score difference for the 36 pathways with keyword “p53” with associated permutation statistic. e, Example violin plot for the top p53 PARADIGM pathway significantly different between ARID1A mutant vs. wild-type tumors. Statistic is FDR-adjusted, two-tailed, unpaired Wilcoxon test.

