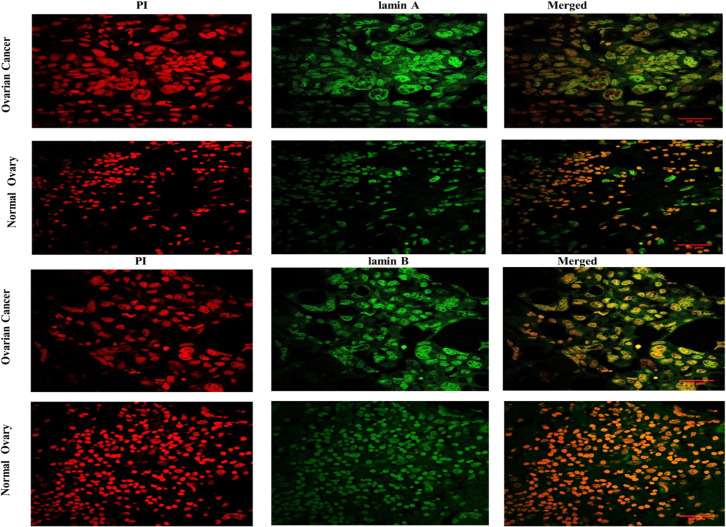
Fig 2. Representative images of confocal micrographs showing the distribution of lamin A and lamin B in tissues from Ovarian cancer and Normal Ovary.
Images of Ovarian Cancer and Normal ovarian tissue nuclei have been marked in their respective columns. Propidium Iodide staining of the nuclei is shown in the first panel containing red channel images. Lamin A and lamin B distributions respectively have been shown in the second panel of green channel images. Merged images of both channels have been shown in the third panel. Magnification: 63X. Scale Bar: 35 μm.

