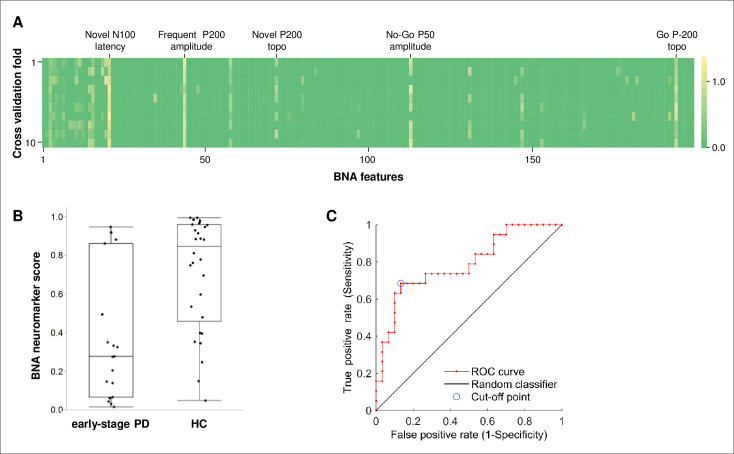
Fig 1. The BNA neuromarker characteristics.
(A) Weights of each feature in each iteration (fold) of the cross-validation process. The consistency of the selected features in each fold can be observed. The names of the 5 most important features of the final model are indicated at the top. (B) BNA neuromarker scores for participants in the ESPD and the HC groups. The scores were obtained from the cross-validation process and represent [1- probability for ESPD]. Whiskers extend to the highest and lowest observations, boxes represent 25–75 interquartile ranges, and horizontal bars represent medians. Mann-Whitney U test (normal approximation): U = 120, Z = -3.38, p-value = 0.0007. (C) Receiver-operating characteristic (ROC) curve for the BNA neuromarker. The cross-validation scores were used for the ROC analysis. topo, topographic similarity; PD, Parkinson’s disease; HC, healthy controls.

