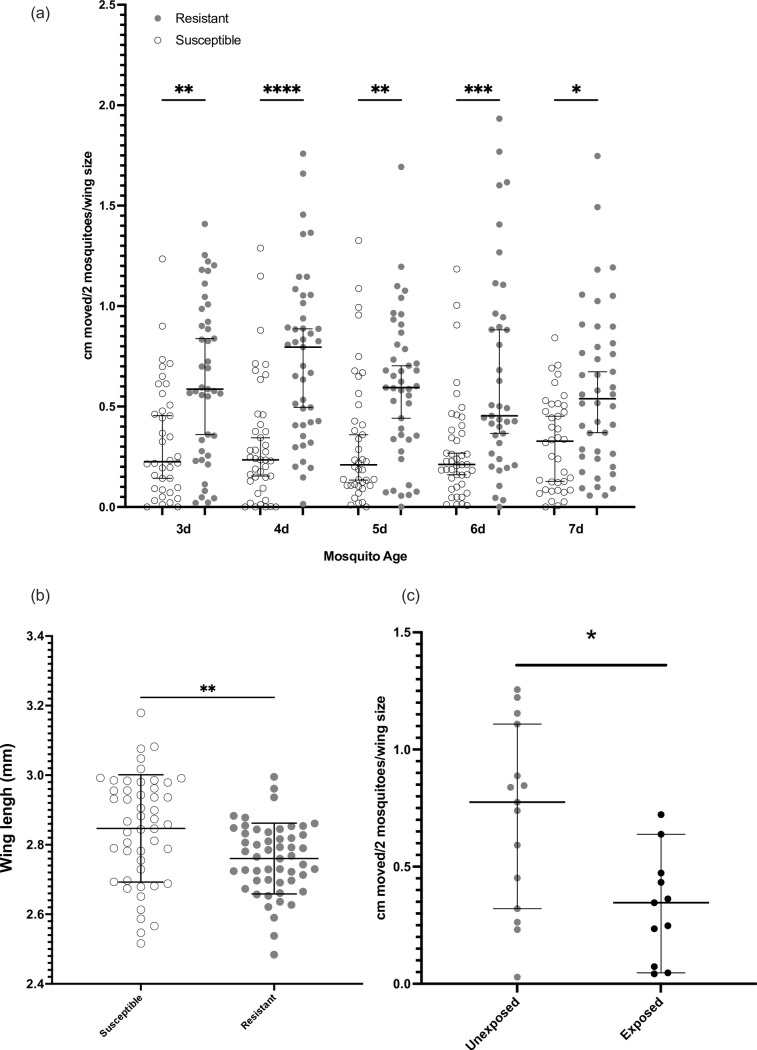
Fig 2. Respirometer and wing measurements for resistant and susceptible lines.
(a) Centimetres moved per two mosquitoes as corrected for average wing size for each mosquito batch (y axis) acts as a proxy measure for the amount of CO2 produced by the mosquitoes across the time points (x axis) for Banfora-R and Banfora-S. Significance calculated by a Kruskall-Wallis test. Error bars show median and 95% confidence intervals. (b) Wing size measurements for Banfora-R and Banfora-S mosquitoes (c) As in (a) comparing Banfora-R unexposed and exposed to the IG1 bed net. Error bars show mean and standard deviation. Significance calculated by t-test. **** p < 0.0001, *** p < 0.001, ** p < 0.01 and * p < 0.05.

