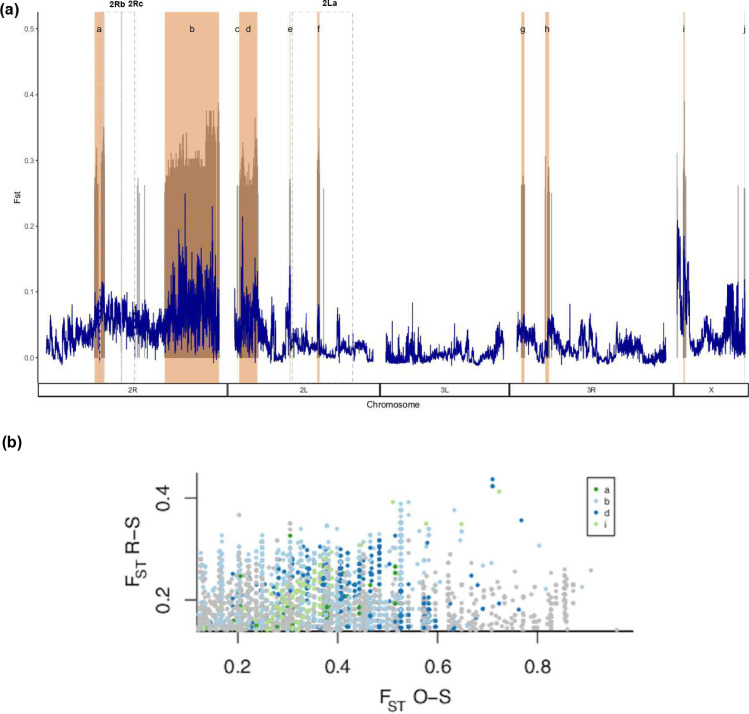
Fig 5. FST between Reselected and Susceptible populations.
(a) FST (y axis) and chromosomal position (x axis) of reselected compared to susceptible populations. Dark blue shows the average FST over 10kb windows and grey are individual SNPs with FST > 0.25. Shaded in pink are regions identified as blocks of divergent SNPs, the inversions are highlighted by dashed grey boxes. (b) SNPs showing high FST and allele frequency difference in the same direction relative to Banfora-S, for Banfora-O and Banfora-R. Several SNP blocks as in part (a) (blocks a, b, d, and i) are highlighted.

