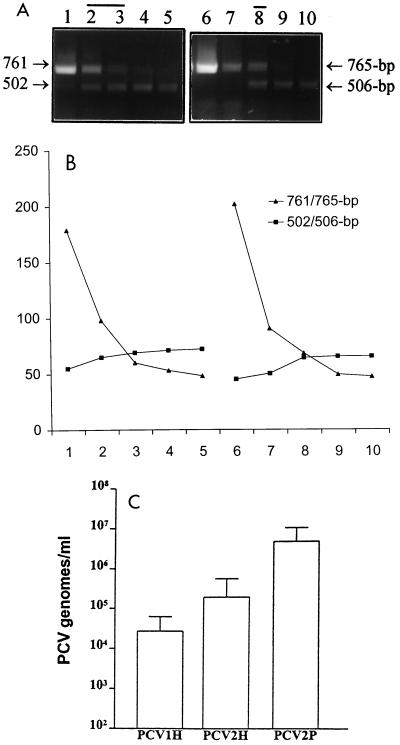
FIG. 3.
Quantification of PCV DNA in serum samples from piglets with different clinical conditions. (A and B) Two representative samples of PCV DNA in serum samples from piglets with different clinical signs. Total DNA was purified from 200 μl of serum, and 10 μl was used per reaction mixture in a cPCR with 10-fold dilutions of competitor DNA. (A) cPCR assay of the PCV1 DNA load present in a clinically healthy piglet (lanes 1 to 5) and the PCV2 DNA burden present in a piglet with PMWS (lanes 6 to 10) with 10 pg, 1 pg, 100 fg, 10 fg, and 1 fg of PCV1 or PCV2 competitor DNA, respectively. The equivalent zone was determined by measuring and plotting the densities of DNA bands (B). (C) PCV DNA loads of healthy and PMWS piglets. The viral loads of PCV1 (n = 11) and PCV2 (n = 25) in healthy piglets (designated PCV1H and PCV2H, respectively) and PCV2 DNA content (n = 16) in piglets with PMWS (designated PCV2P) were demonstrated. Error bars represent the standard deviation from the mean.

