Figure 7.
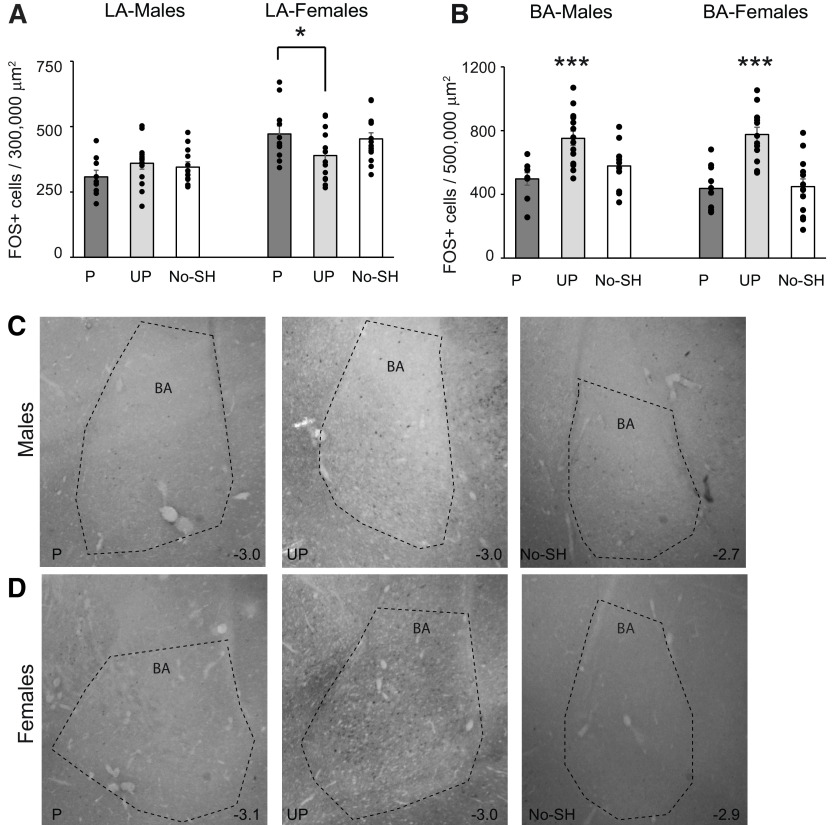
Conditioning to paired and unpaired cues upregulates FOS in the BLA. A, Mean +/- s.e.m. FOS+ cells in the LA in the paired (P), unpaired (UP), and no shock (No-SH) group in males and females. Asterisk indicates a significant difference in FOS between females in the paired group and the unpaired group. B, Mean +/- s.e.m. FOS+ cells in the BA in the paired (P), unpaired (UP), and no shock (No-SH) group in males and females. Asterisk indicates significant higher numbers of FOS-positive cells in the unpaired group than in the two other groups in males and females (ps < 0.005). C, D, Photomicrographs of the BA in males (C) and females (D) in the cued, random and no shock groups. Anterior-posterior distance from bregma (in mm) is denoted in the lower right of each image.

