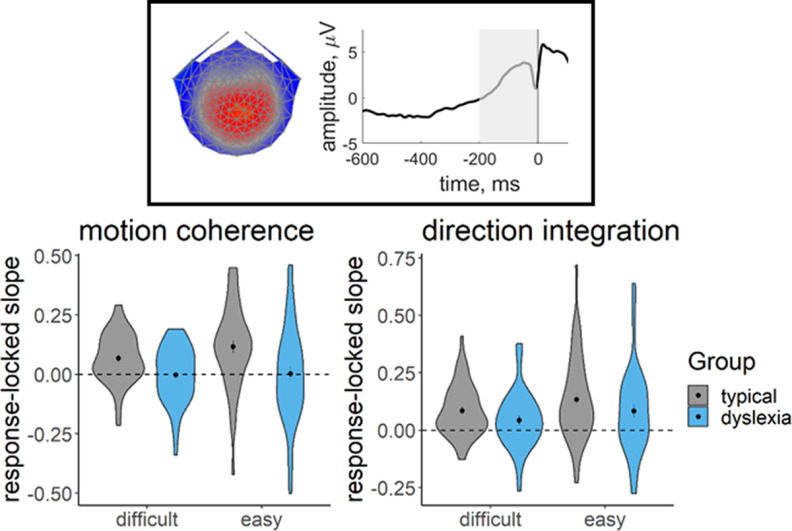
Figure 11.
EEG slope measure extracted for inclusion in the joint model. Violin plots showing the kernel probability density for the EEG slope measure extracted for inclusion in the joint model for each group (gray represents typically developing; blue represents dyslexia) for each difficulty level. The extracted measure was the slope of a linear regression line fitted to each participant's deconvolved (with regularization) response-locked waveform, from 200 ms before the response to the response (see shaded area of schematic response-locked waveform in inset). Dotted line indicates a flat slope. Dots and vertical lines represent the group mean and ±1 SEM.

