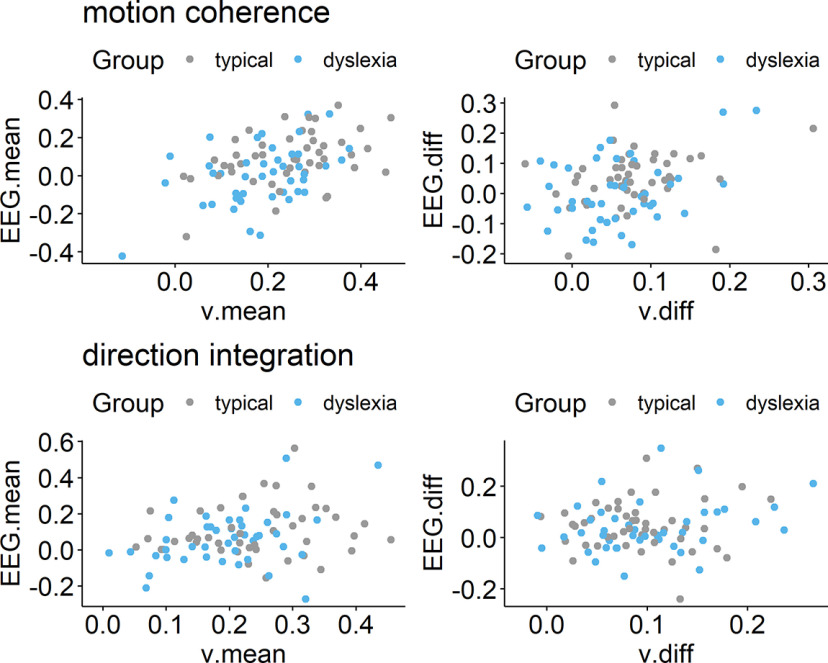
Figure 12.
Scatterplots showing relationship between drift rate and EEG. Left panels, Maximum likelihood estimates contained within the posterior for each participant's mean drift rate across difficulty levels (v.mean) plotted against the slope of EEG activity averaged across difficulty levels (EEG.mean) for the motion coherence (top) and direction integration (bottom) tasks. Right panels, Estimates for each participant's difference in drift rate between difficulty levels (v.diff) plotted against the difference in slopes of EEG activity between the two difficulty levels (EEG.diff), for each task. Gray represents typically developing children. Blue represents children with dyslexia.

