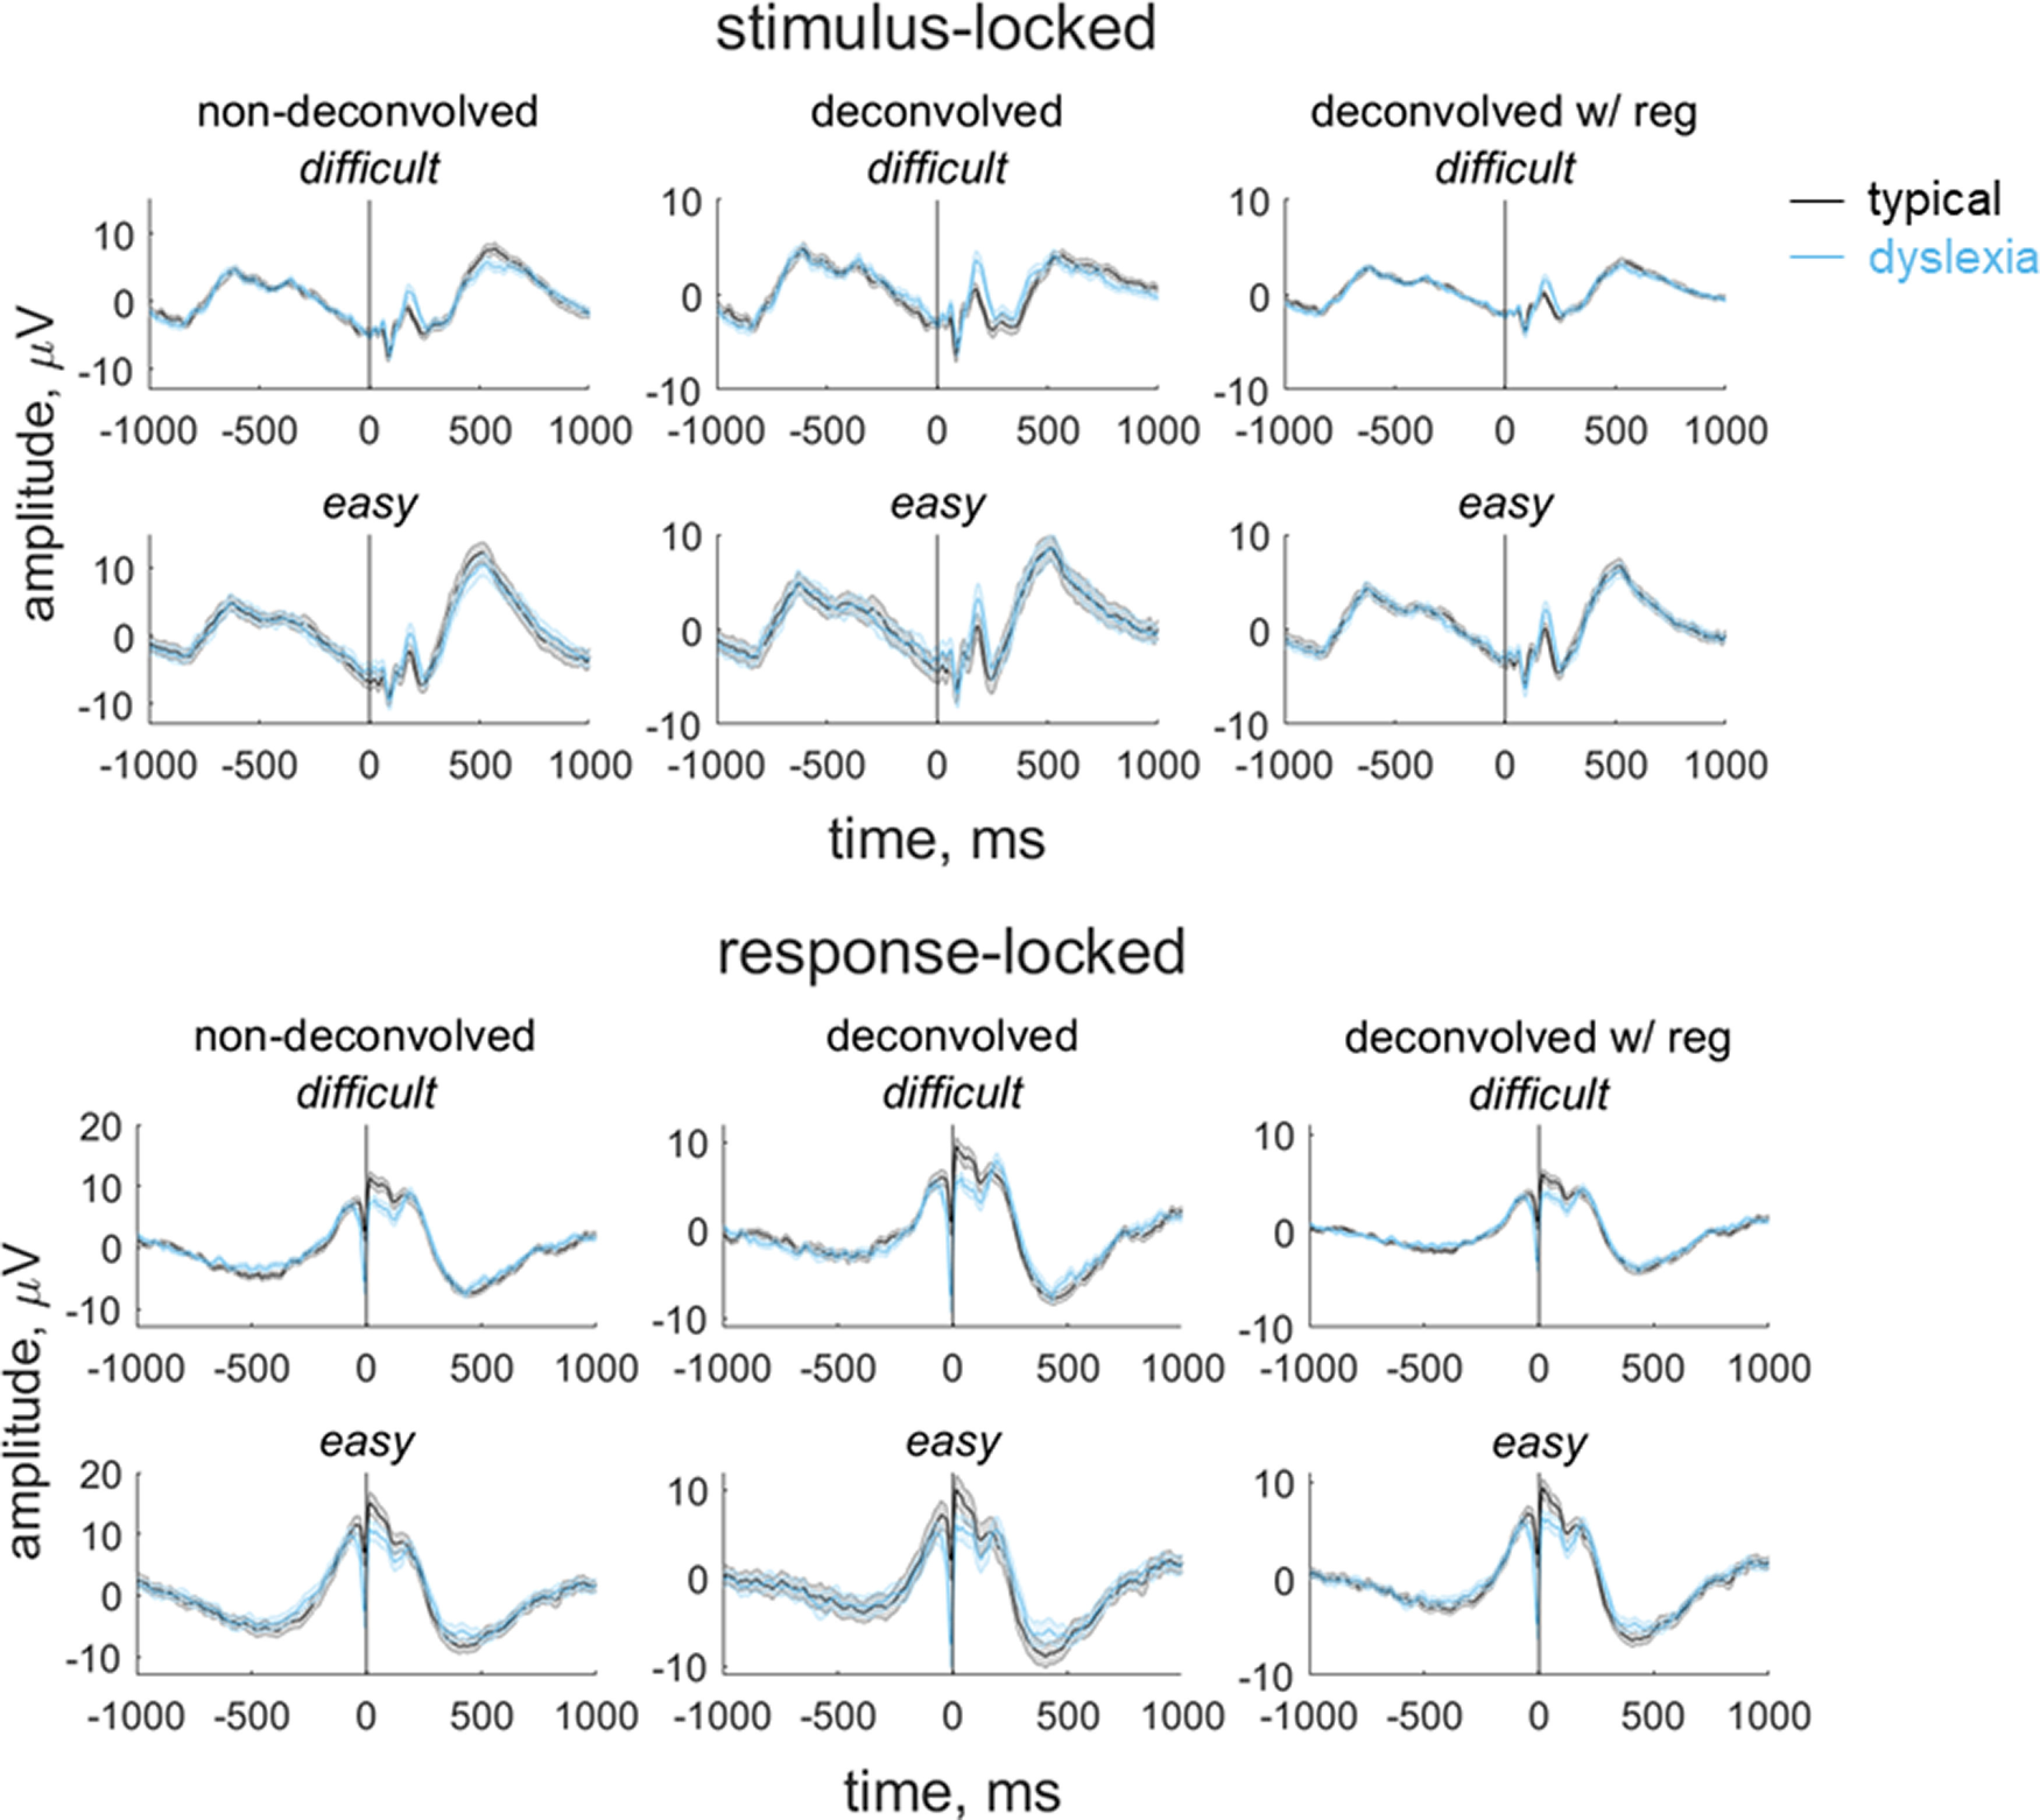
Figure 4.

Group average stimulus-locked and response-locked evoked potentials for the motion coherence task. Average (±1 SEM) stimulus-locked (top) and response-locked (bottom) evoked potentials for typically developing children (gray) and children with dyslexia (blue) in the motion coherence task for difficult and easy levels. Left column represents nondeconvolved group average waveforms. Middle column represents deconvolved group average waveforms (without regularization). Right column represents deconvolved group average waveforms with regularization (ridge regression). Vertical line at 0 ms indicates when the stimulus phase started (stimulus-locked) or when the response was made (response-locked).
