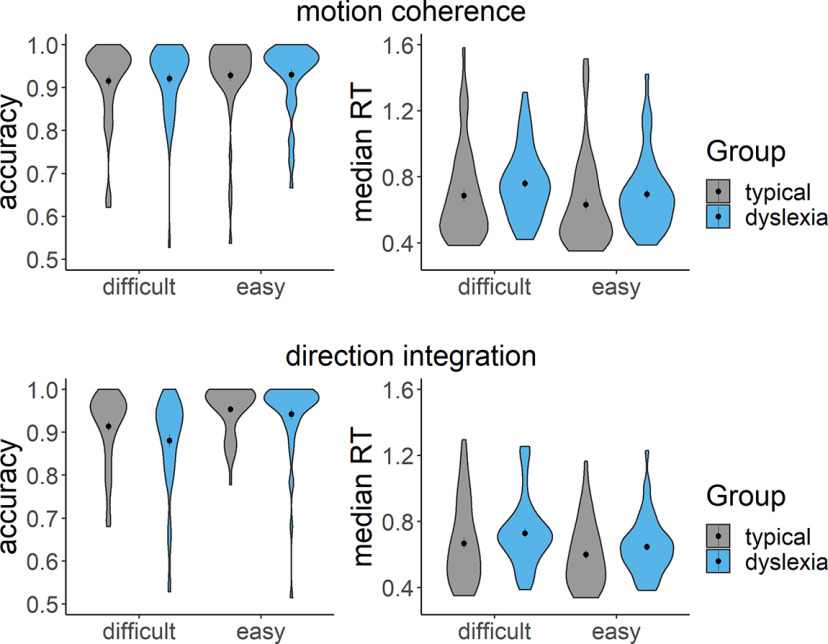
Figure 6.
Accuracy and median RT for correct trials. Violin plots showing the kernel probability density for each group's accuracy (left) and median RT (s) for correct trials (right) for each difficulty level and each task (top: motion coherence; bottom: direction integration). Data for typically developing children and children with dyslexia are presented in gray and blue, respectively. Dots and vertical lines represent the group mean and ±1 SEM.

