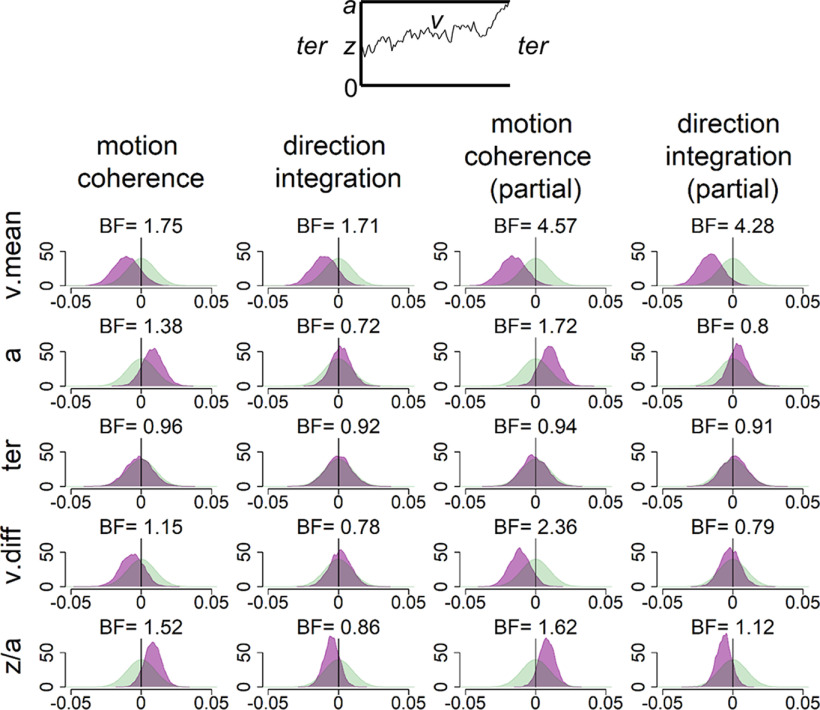
Figure 8.
Prior and posterior density distributions. Prior (green) and posterior (purple) density distributions for the group-level parameters reflecting group differences in each of the five model parameters (v.mean, mean drift rate across difficulty levels; a, boundary separation; ter, nondecision time; v.diff, difference in mean drift rate between difficulty levels; z/a, relative starting point) for each task. Top inset, Schematic of the model parameters shown. Leftmost columns represent the results of the standard model. Rightmost columns represent the results of the model with age partialled out. Negative values reflect lower parameter values in the dyslexia group compared with the typically developing group. BF, Savage-Dickey BFs in favor of the alternative hypothesis (H1) over the null hypothesis (H0). BF > 1 support H1.

