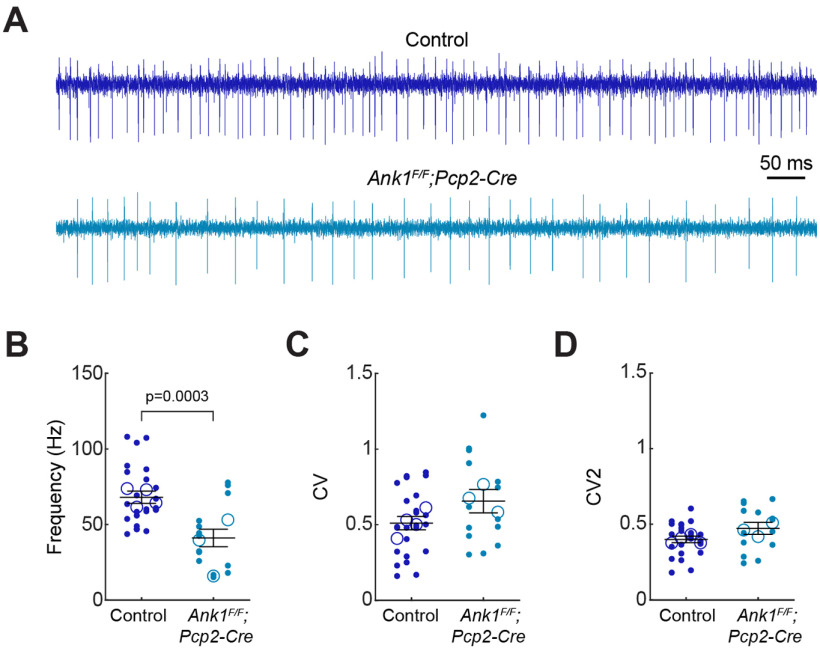
Figure 6.
Loss of AnkR from Purkinje neurons results in reduced cerebellar output. A, Example traces of electrophysiological recordings from nuclei cell from control and Ank1F/F;Pcp2-Cre mice. B, Firing frequency of CN cells recorded in control (frequency = 68.0 ± 4.0 Hz) and Ank1F/F;Pcp2-Cre (frequency = 41.1 ± 5.2 Hz) mice. C, CV (global variability of ISIs) of CN cells recorded in control (CV = 5.1 ± 0.04) and Ank1F/F;Pcp2-Cre (CV = 0.66 ± 0.06) mice. D, CV2 (local variability of ISIs) of CN cells recorded in control (CV2 = 0.40 ± 0.02) and Ank1F/F;Pcp2-Cre (CV2 = 0.47 ± 0.03) mice. Small, filled circles are the firing frequency of individually recorded cells. Large, open circles represent average firing frequency of individual animals. Each vertical column of datapoints represents an individual animal. 11- to 12-month-old control (N = 4 mice, n = 24 cells) and Ank1F/F;Pcp2-Cre (N = 3 mice, n = 14 cells) animals. Error bars indicate mean ± SEM of all recorded cells for each genotype. Statistical significance was determined using a linear mixed model with genotype as a fixed variable and mouse number as a random variable.

