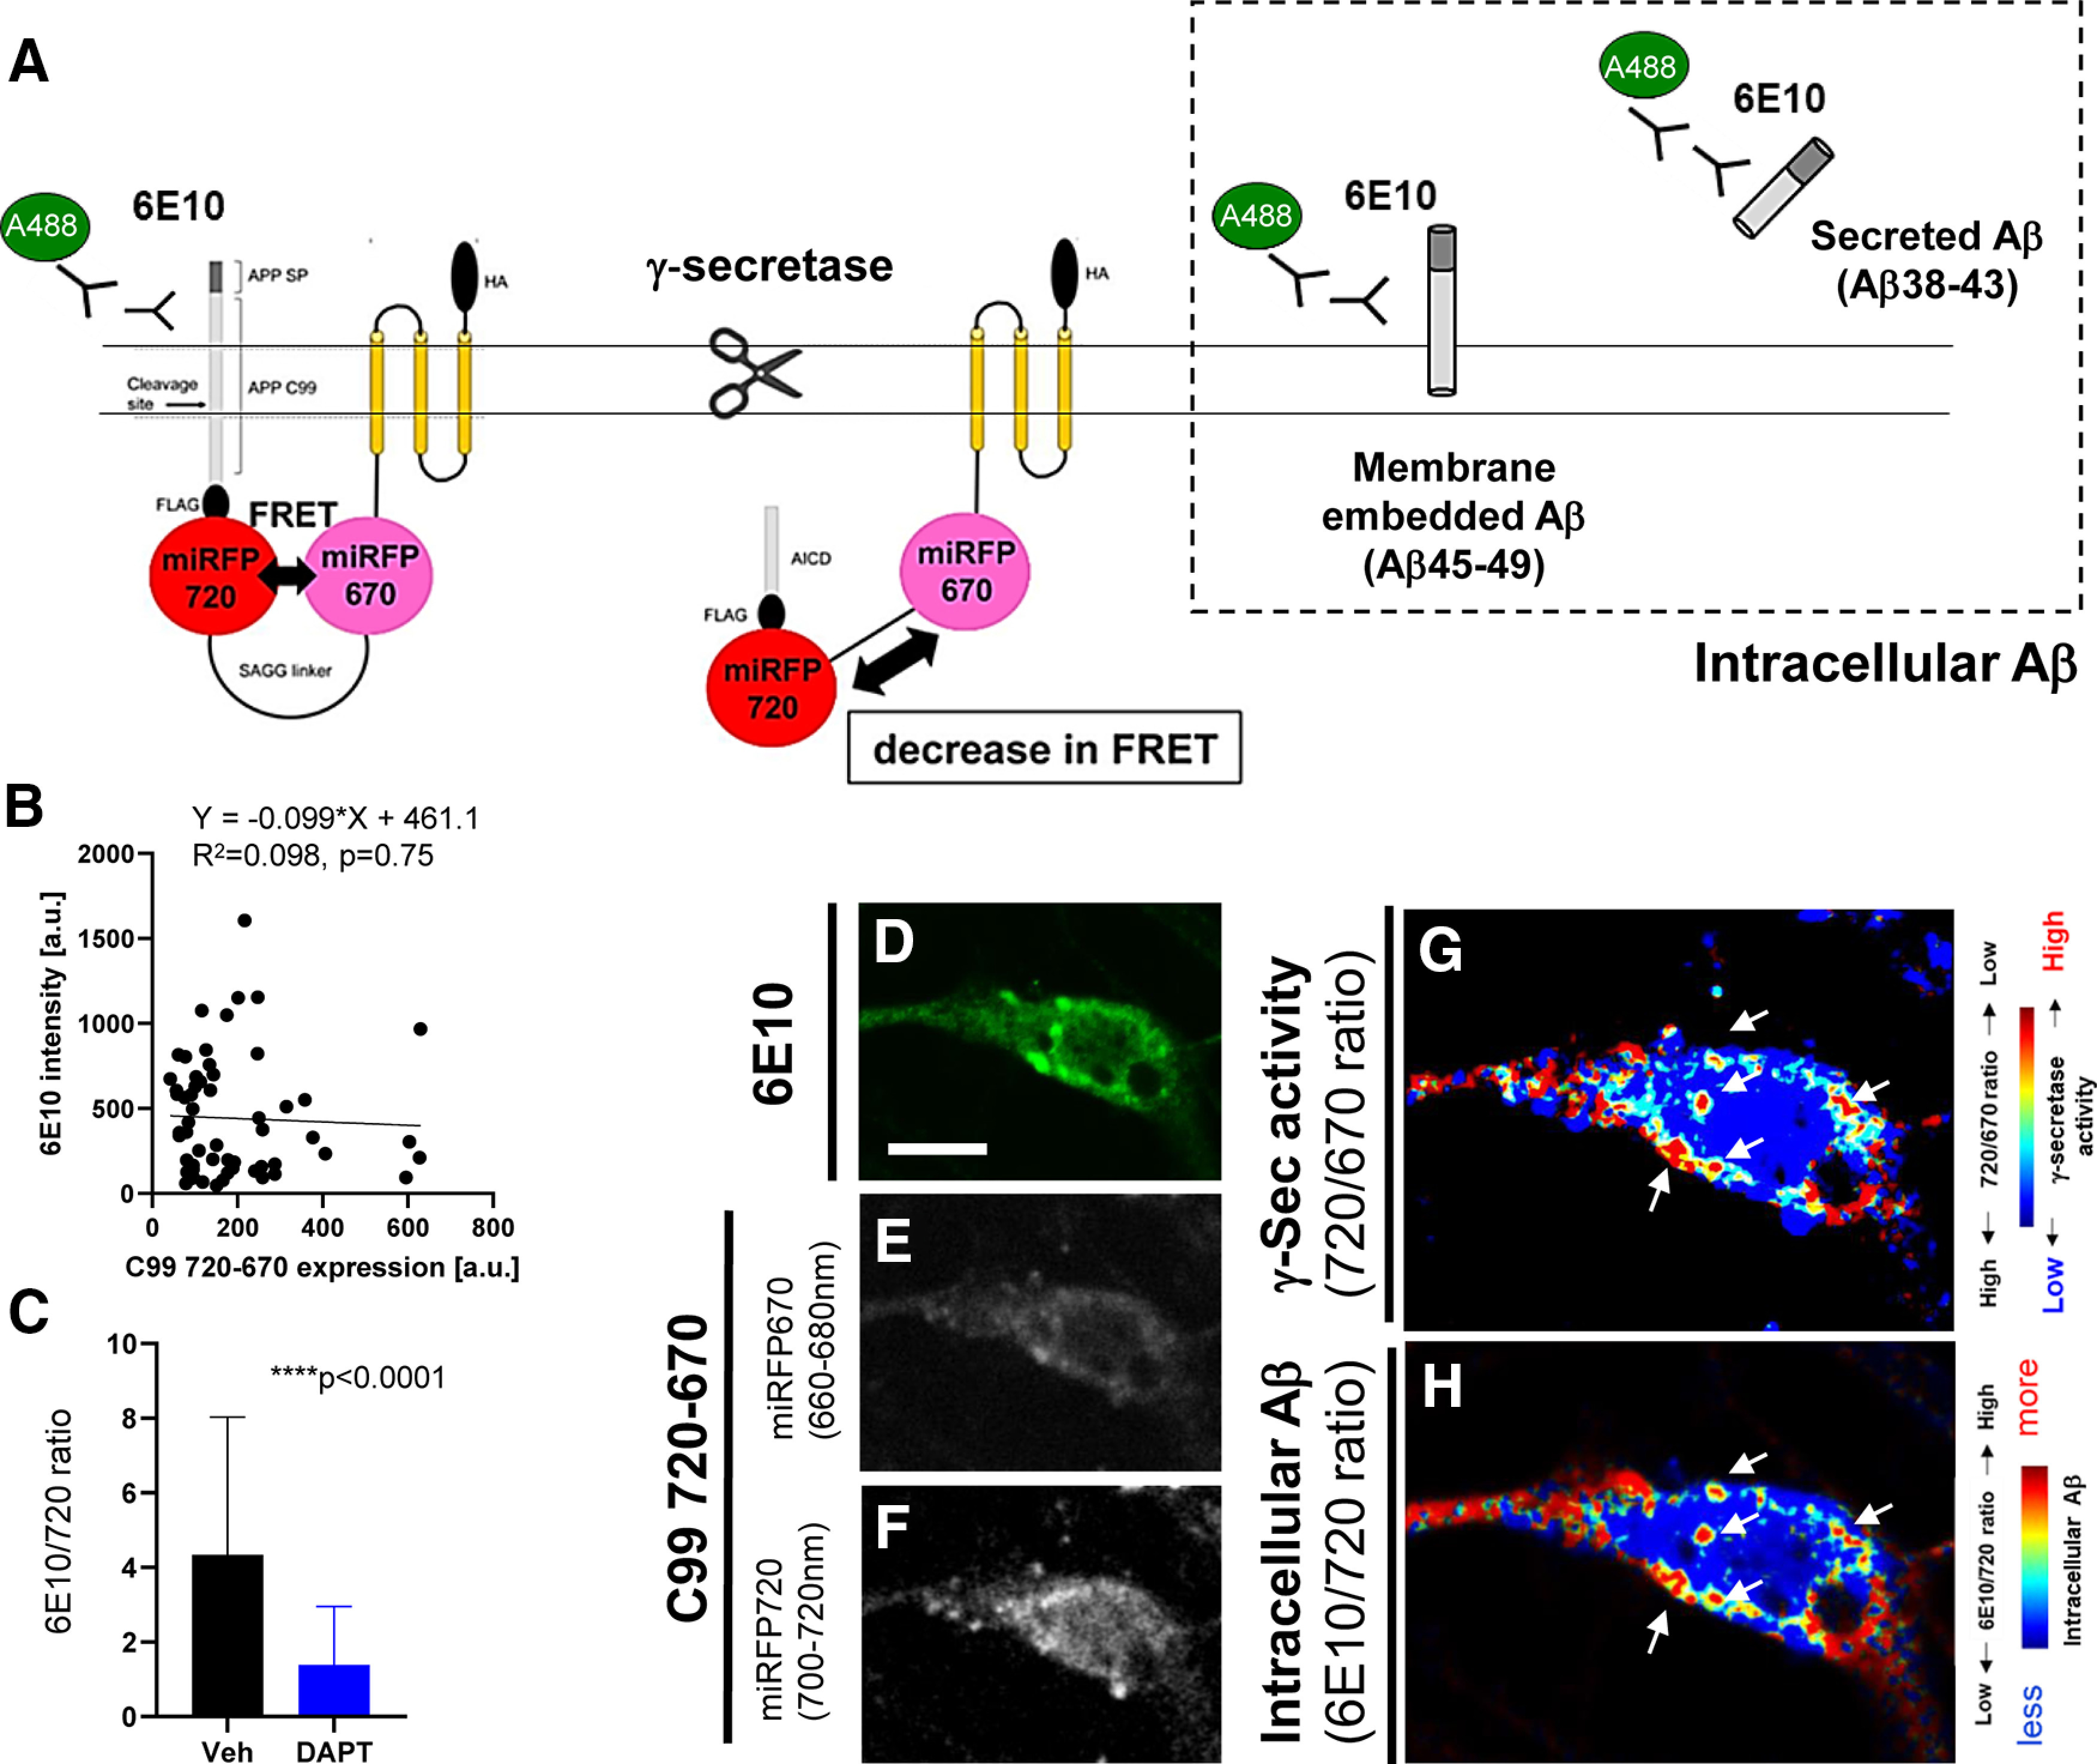
Figure 4.

Visualization of intracellular Aβ derived from the C99 720-670 biosensor in neurons. A, A schematic representation of the immunostaining approach distinguishing Aβ from the C99 720-670 biosensors. B, No correlation between 6E10 emission intensity and C99 720-670 biosensor expression levels (i.e., miRFP720 emission); n = 58 neurons, Y = −0.099× + 461.1, R2 = 0.098, n.s. p = 0.75 (C) 6E10 over miRFP720 emission ratios are significantly decreased by the treatment with 1 μm DAPT, a potent γ-secretase inhibitor; n = 50 neurons, Mann–Whitney U test, ****p < 0.0001. Primary neurons expressing the C99 720-670 biosensor were immunostained with the 6E10 antibody, followed by an Alexa Fluor 488-conjugated secondary antibody. Representative images of the 6E10 intensity (D), miRFP670 (E), and miRFP720 (F). Pseudo-colored images corresponding the 720/670 ratios (i.e., lower ratio = more γ-secretase activity: highlighted by red; G) and 6E10/720 ratios (i.e., higher ratio = more intracellular Aβ, which is highlighted by red; H). Scale bar: 10 µm.
