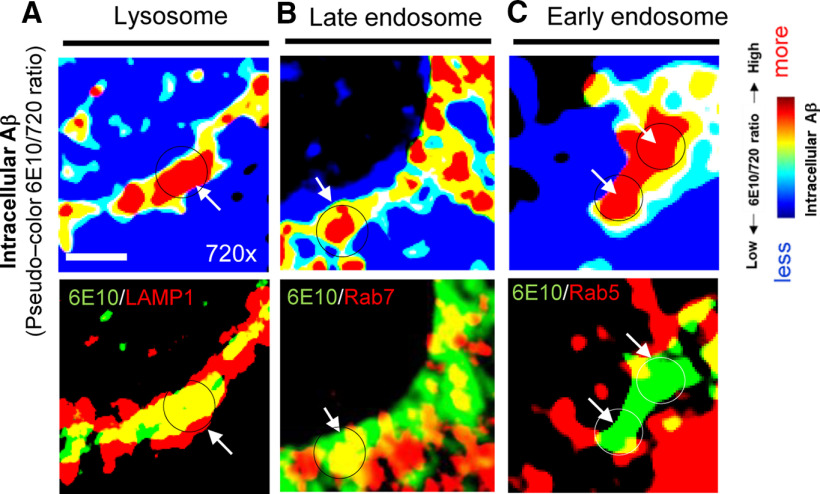
Figure 5.
Colocalization analysis of intracellular Aβ and endo-lysosomal markers. A, Higher magnification pseudo-colored images corresponding the 6E10/720 ratios (i.e., higher ratio = more intracellular Aβ, which is highlighted by red) and LAMP1 (a lysosome marker), (B) Rab7 (late endosome), or (C) Rab5 (early endosome), indicating predominant localization of intracellular Aβ in lysosomes. Scale bar: 2 µm.

