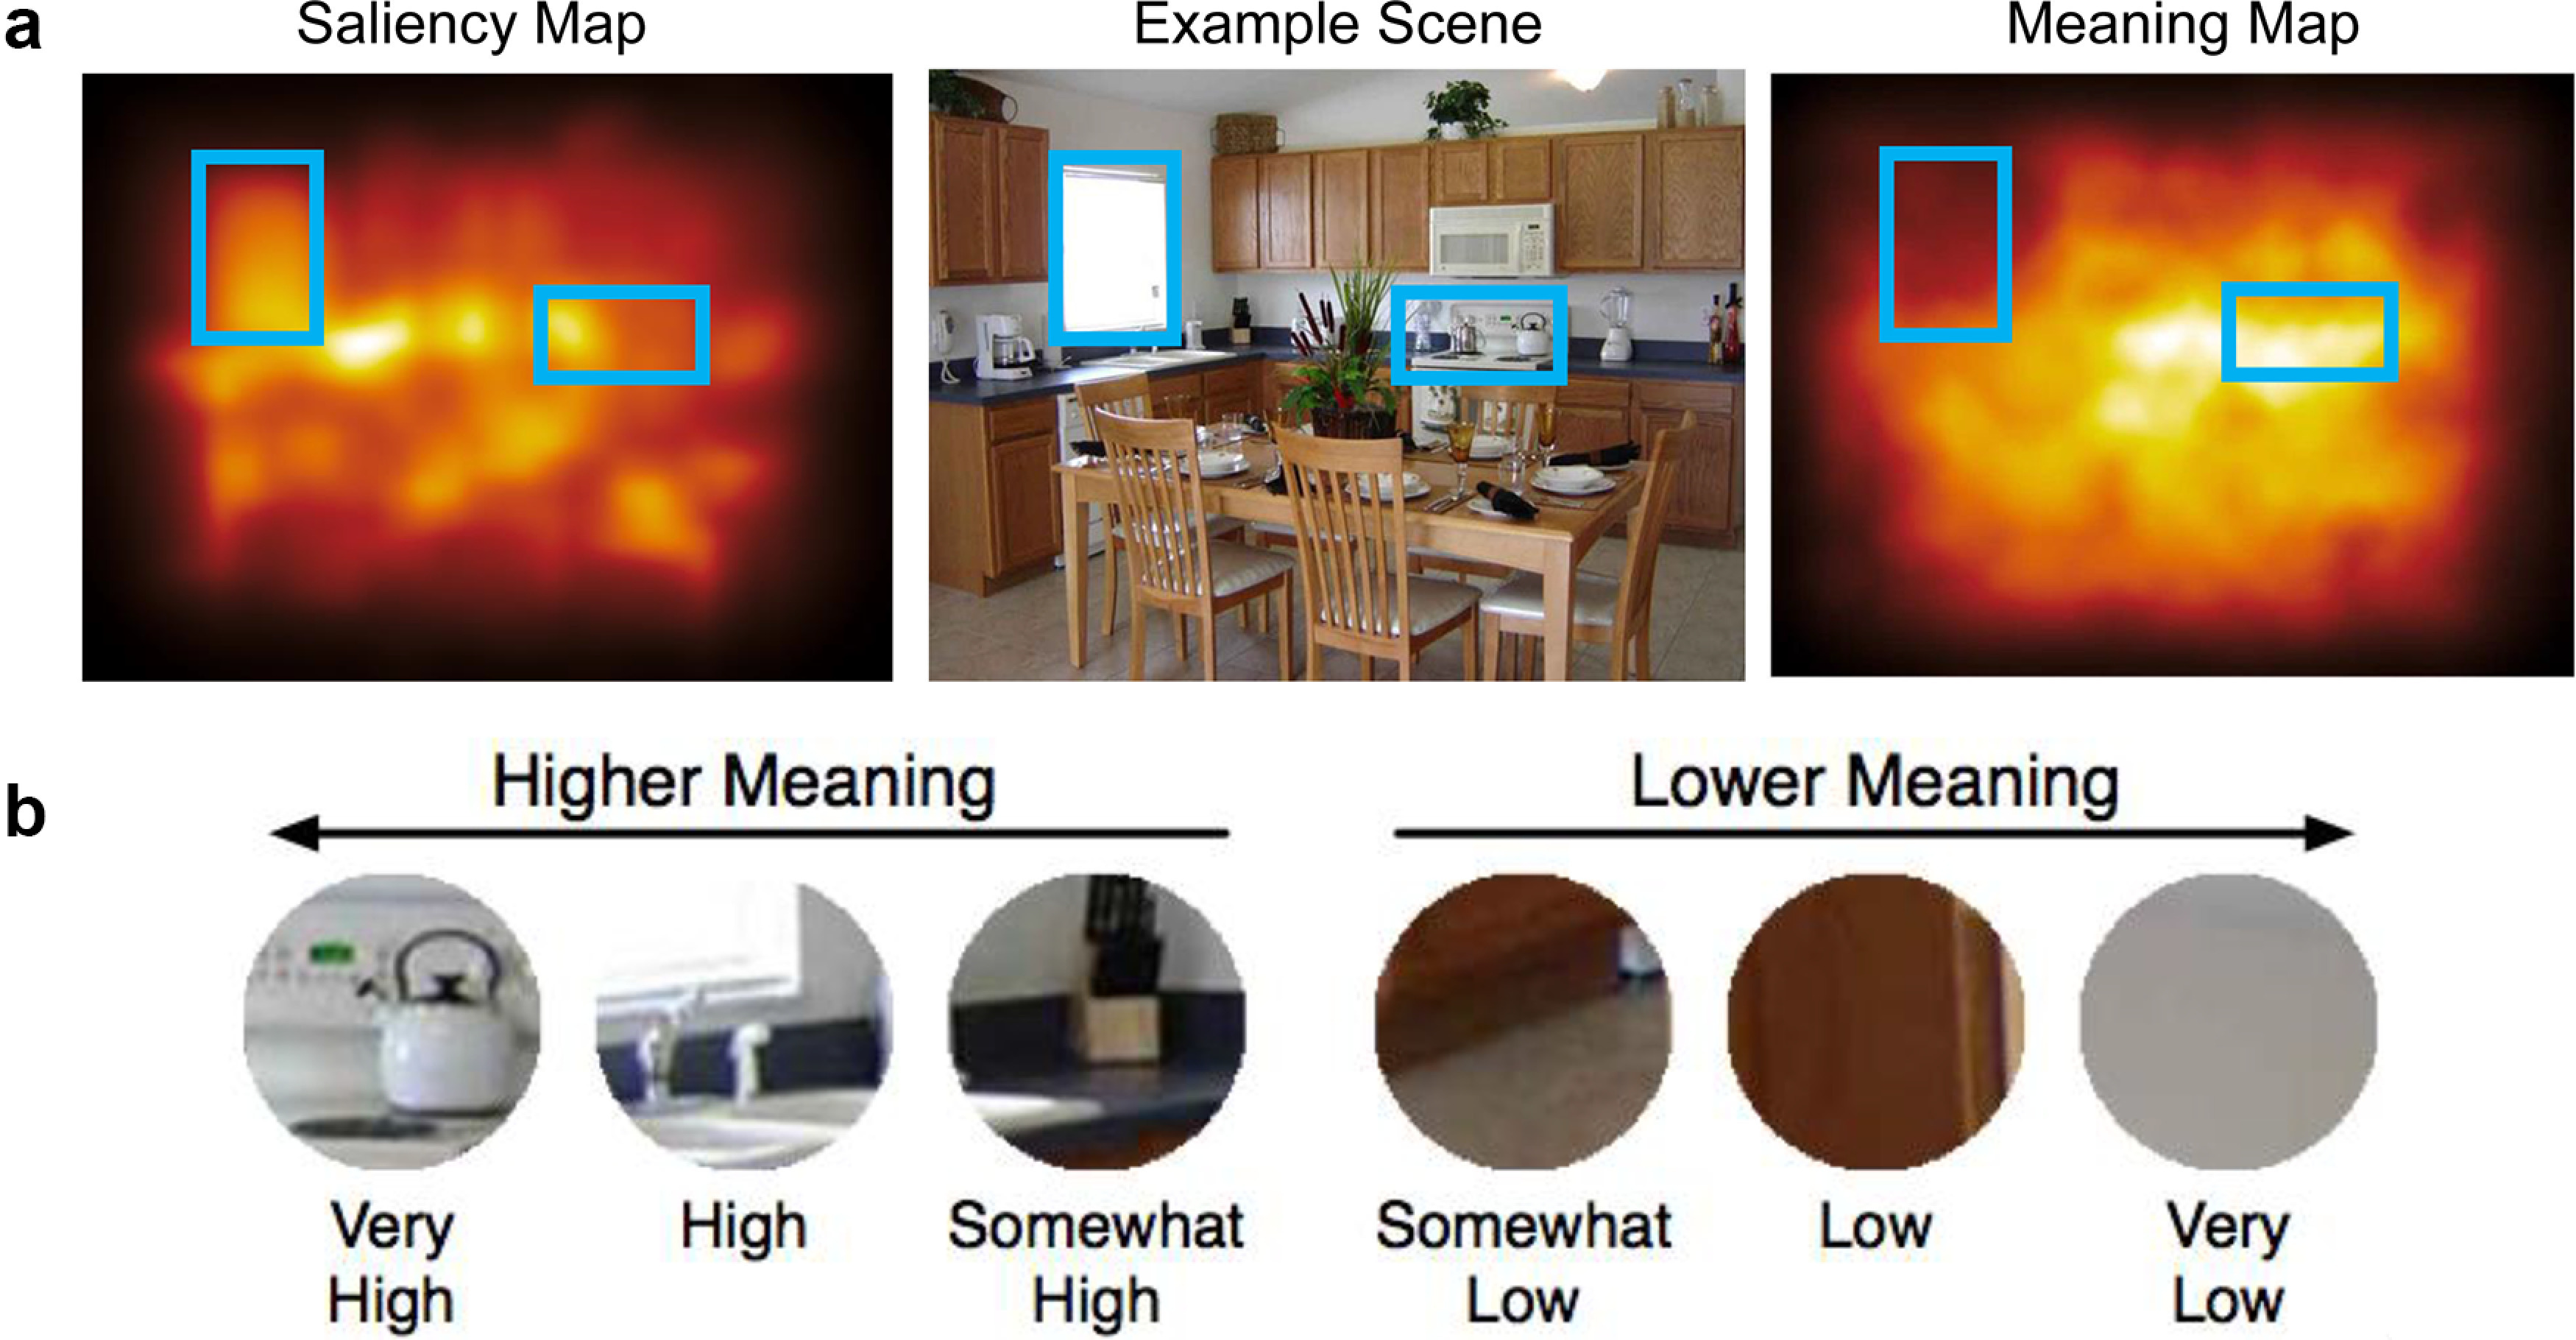
Figure 2.

a, Example scene along with its corresponding physical saliency map and meaning map. The blue rectangles were not present in the scene but were added here to highlight specific regions in each map type. In this example, the region highlighted on the left is high in physical saliency (being brighter than the surrounding regions) but low in meaning (being largely homogeneous). By contrast, the region highlighted on the right is high in semantic saliency (as it contains easily identifiable objects) while being relatively low in physical saliency. b, Examples of the patches used to construct the meaning maps and their ratings. Subjects viewed and rated the meaningfulness of each individual patch in isolation.
