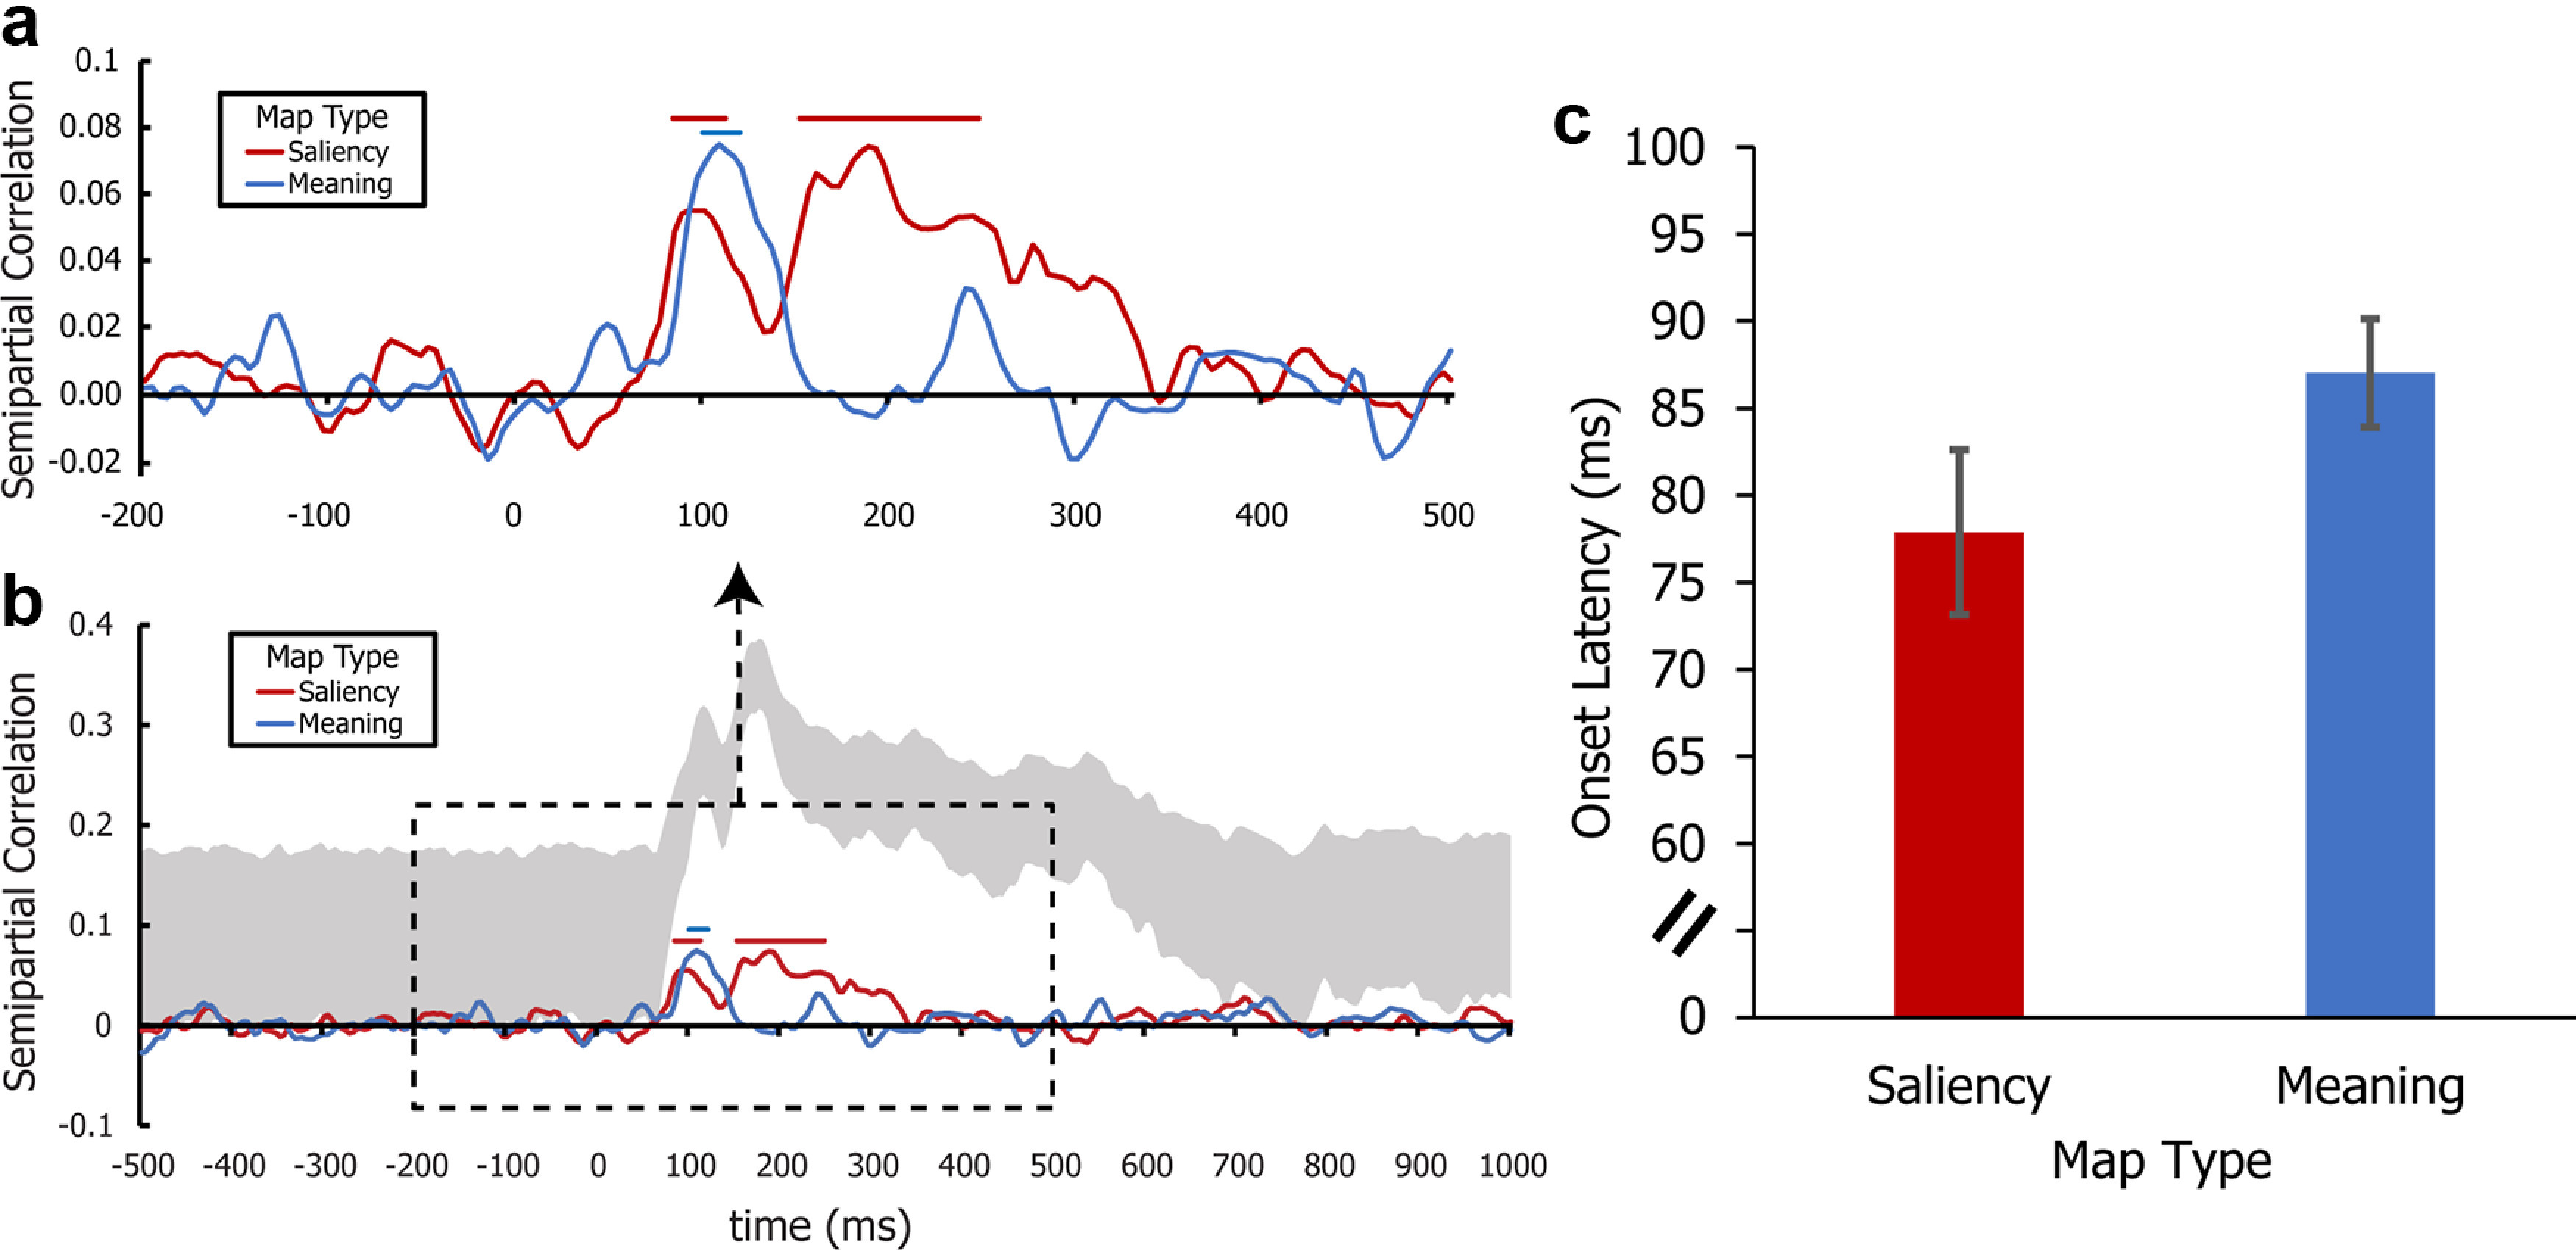
Figure 5.

a, Representational similarity time course between the ERP data (i.e., the ERP representational dissimilarity matrices computed from all scalp electrodes) and each of the two map types (saliency and meaning) from −200 ms before stimulus to 500 ms after stimulus. Representational similarity was computed separately for each participant, with the mean across participants being shown here. Horizontal line segments across the top indicate time periods in which the representational similarity values were significantly >0 (p < 0.05 correcting for the FDR). b, Full time course of the representational link shown in a. The upper and lower edges of the gray region denote the upper and lower bound estimates of the estimated noise ceiling (i.e., the highest expected observed correlation) of the ERP data. c, Jackknifed mean onset latency for physical and semantic saliency in the ERP data. Error bars indicate the jackknife-corrected SE.
