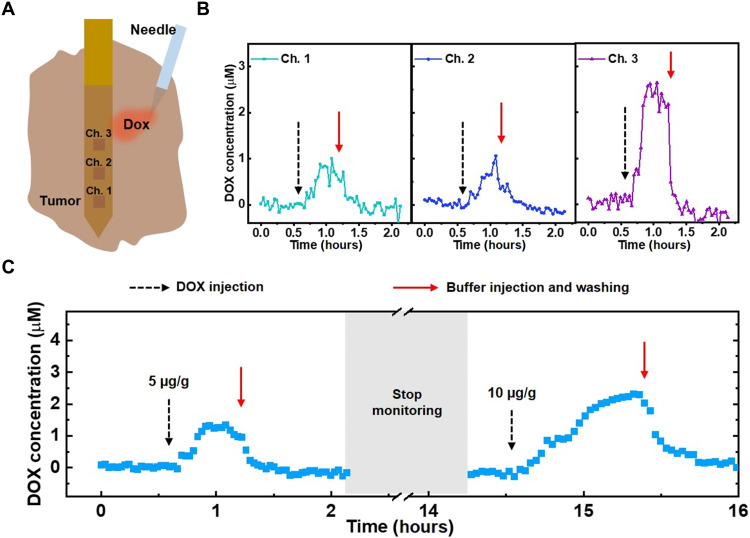
Fig. 4. Ex vivo monitoring of DOX in tumor tissue.
(A) The sensor was implanted into extracted tumor tissue, after which a bolus of DOX was injected. (B) Real-time DOX concentration at each channel after injecting a bolus of DOX (5 μg/g) (black dashed arrow) at a tumor site near channel 3, followed by washing with 1× SSC buffer (red solid arrow). (C) Averaged real-time DOX concentrations from the three sensor channels in tumor tissue over the course of 16 hours after spiking in boluses of DOX (5 or 10 μg/g) at different time points. SWV frequency = 200 Hz, amplitude = 50 mV, n = 3 channels.

