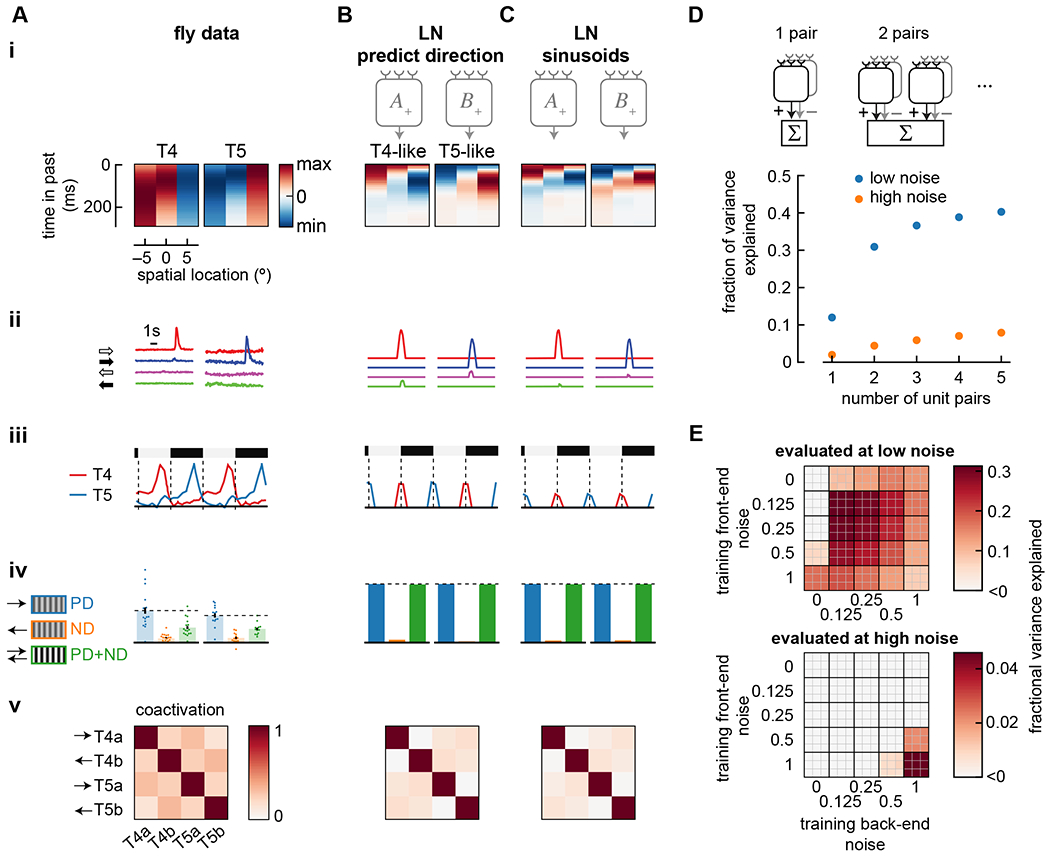
Figure 4. Effects of model loss function, training, architecture, and noise.

A) Summary of properties measured in T4 and T5 (from Figure 1). Data shows false color time traces of 3 spatially separated input filters (i), responses to light and dark edges moving left and right (ii), responses to stationary square waves (iii), responses to preferred and null direction sinusoids, and their sum (iv), and coactivation of units in response to naturalistic stimuli (v).
B) As in (A), but showing the results of an LN model with an alternate loss function, in which it was trained to predict direction of motion rather than predict velocity of motion. Compare with Figure 3B. Model was trained with noise of η = σ = 1.
C) As in (A), but showing the results of an LN model trained on sinusoidal gratings instead of natural scenes. Compare with Figure 3B. Model was trained with noise of η = σ = 1.
D) The number of mirror-symmetric, subtracted unit pairs was swept from one to five (top), while measuring the fraction of variance explained for LN models trained and evaluated in high and low noise conditions. All unit pairs received inputs from the same 3 spatial locations. Throughout the rest of this study, two pairs were used.
E) Fraction of variance explained by models trained at a variety of front- and back-end noise levels, then tested at low noise (top) and high noise (bottom). The top 9 models are shown as a 3x3 grid at the coordinate of a specific parameter set. Low noise evaluation used parameters η = σ = 0.125; high noise evaluation used parameters η = σ = 1.
See also Figures S2 and S3.
