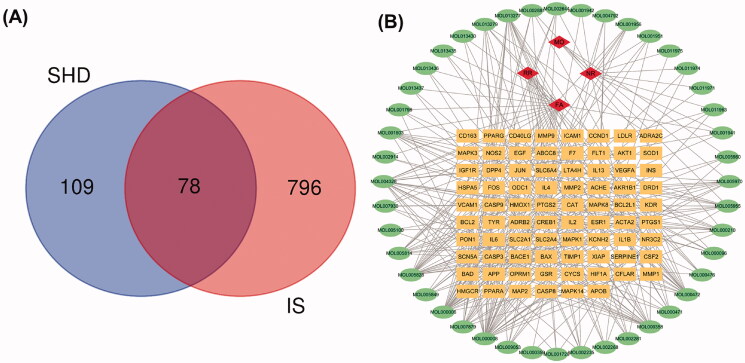
Figure 3.
Venn diagram and disease-compound-target network of SHD. (A) The intersection of the potential SHD and ischaemic stroke targets. (B) Network of the targets shared between SHD and ischaemic stroke. The orange rectangles represent the potential targets, the green circles represent the compounds and the red diamonds represent the herbs.

