Figure 5.
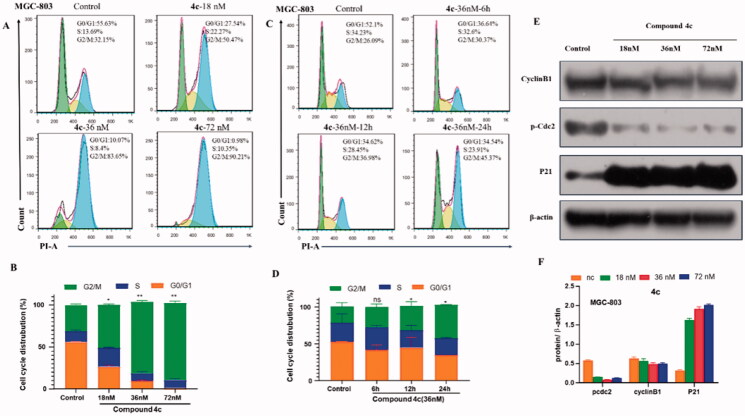
Compound 4c induced G2/M arrest in MGC-803 cancer cells. (A) The percentages of cells at different phase of the cell cycle after treatment with various concentrations of 4c. (B) Histograms display the percentage of cell cycle distribution. (C) The percentage of different phase of the cell cycle after treatment with the same concentration for different times. (D) Histograms display the percentage of cell cycle distribution for different times. (E) Western blotting analysis on the effect of 4c on the G2/M regulatory proteins. (F) Histograms display the density rations of p-Cdc2, CyclinB1 and P21.

