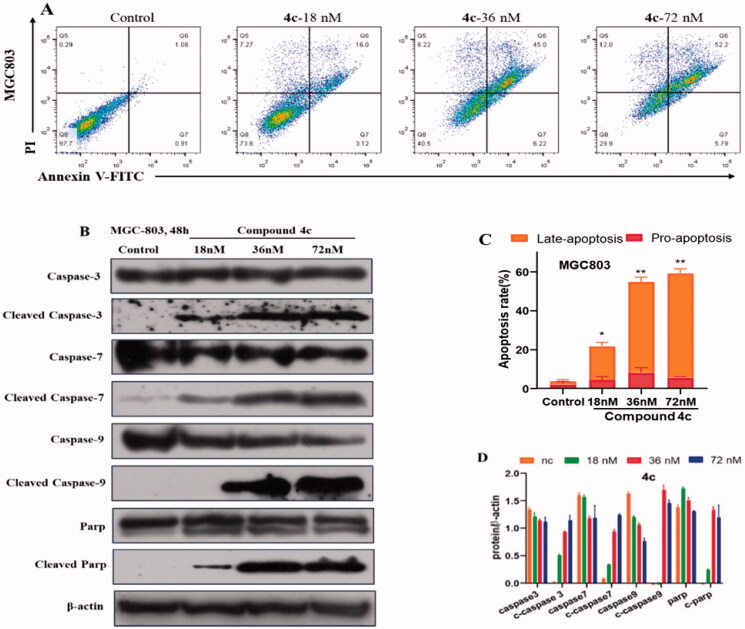
Figure 6.
Compound 4c induced apoptosis in MGC-803 cancer cells. (A) MGC-803cells stained with Annexin V/PI, followed by flow cytometric analysis. (B) Western blot analysis of apoptosis-related proteins. (C) Histograms display the percentage of apoptosis cells. (D) Histograms display the density ratios of Caspase -3/-7/-9, cleaved Caspase -3/-7/-9, Parp and cleaved Parp.

