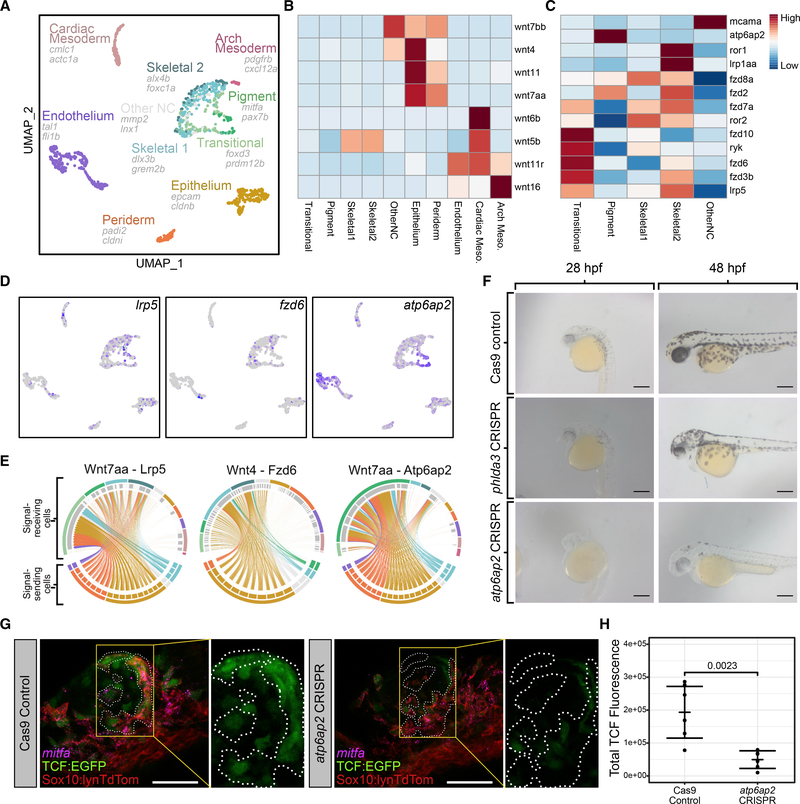
Figure 7. Emergence of pigment and skeletal lineages in NC cells coincides with Wnt signals from epithelial tissues.
(A) UMAP showing all cell types isolated from photoconverted PA1 NC cells. Cell types determined from top DE genes and combined with NC subtype identities from our NC-specific analysis.
(B) Heatmap showing average expression of Wnt ligands in each cell type.
(C) Heatmap showing average expression of Wnt receptors in each cell type.
(D) Feature plots showing expression of Wnt receptors lrp5, fzd6, and atp6ap2.
(E) Circos plots showing imputed signaling interactions. Top segments of each circle indicate signal-receiving cells. Bottom segments indicate signal-sending cells. Each line indicates a signaling event between two individual cells. Lines are colored according to the cell type identity of the signal-sending cell. Colors are consistent with UMAP.
(F) Live embryos injected with either Cas9 alone (top row) or Cas9 and 4 gRNAs targeting phlda3 (middle row) or atp6ap2 (bottom row) shown in lateral views at 28 hpf (left column) and 48 hpf (right column). Note reduced black melanocyte pigmentation with atp6ap2 CRISPR.
(G) Confocal micrographs showing Wnt-responsive TCF-EGFP (green, outlined by dashed white lines) and mitfa (magenta) expression in PA1 at 24 hpf in tg(sox10:lynTdTomato;7xTCF:EGFP) embryos where NC plasma membranes are marked by tdTomato (red).
(H) Quantification of 7xTCF:EGFP using corrected total fluorescence intensity between control embryos (n = 7 embryos; mean = 193,407) and atp6ap2 CRISPR embryos (n = 6 embryos; mean = 49,567). Wilcoxon rank-sum test p = 0.0023. Dots represent mean in individual embryos. Lines represent mean within conditions. Error bars represent mean ± SD.
For micrographs, scale bars represent 50 μm.

