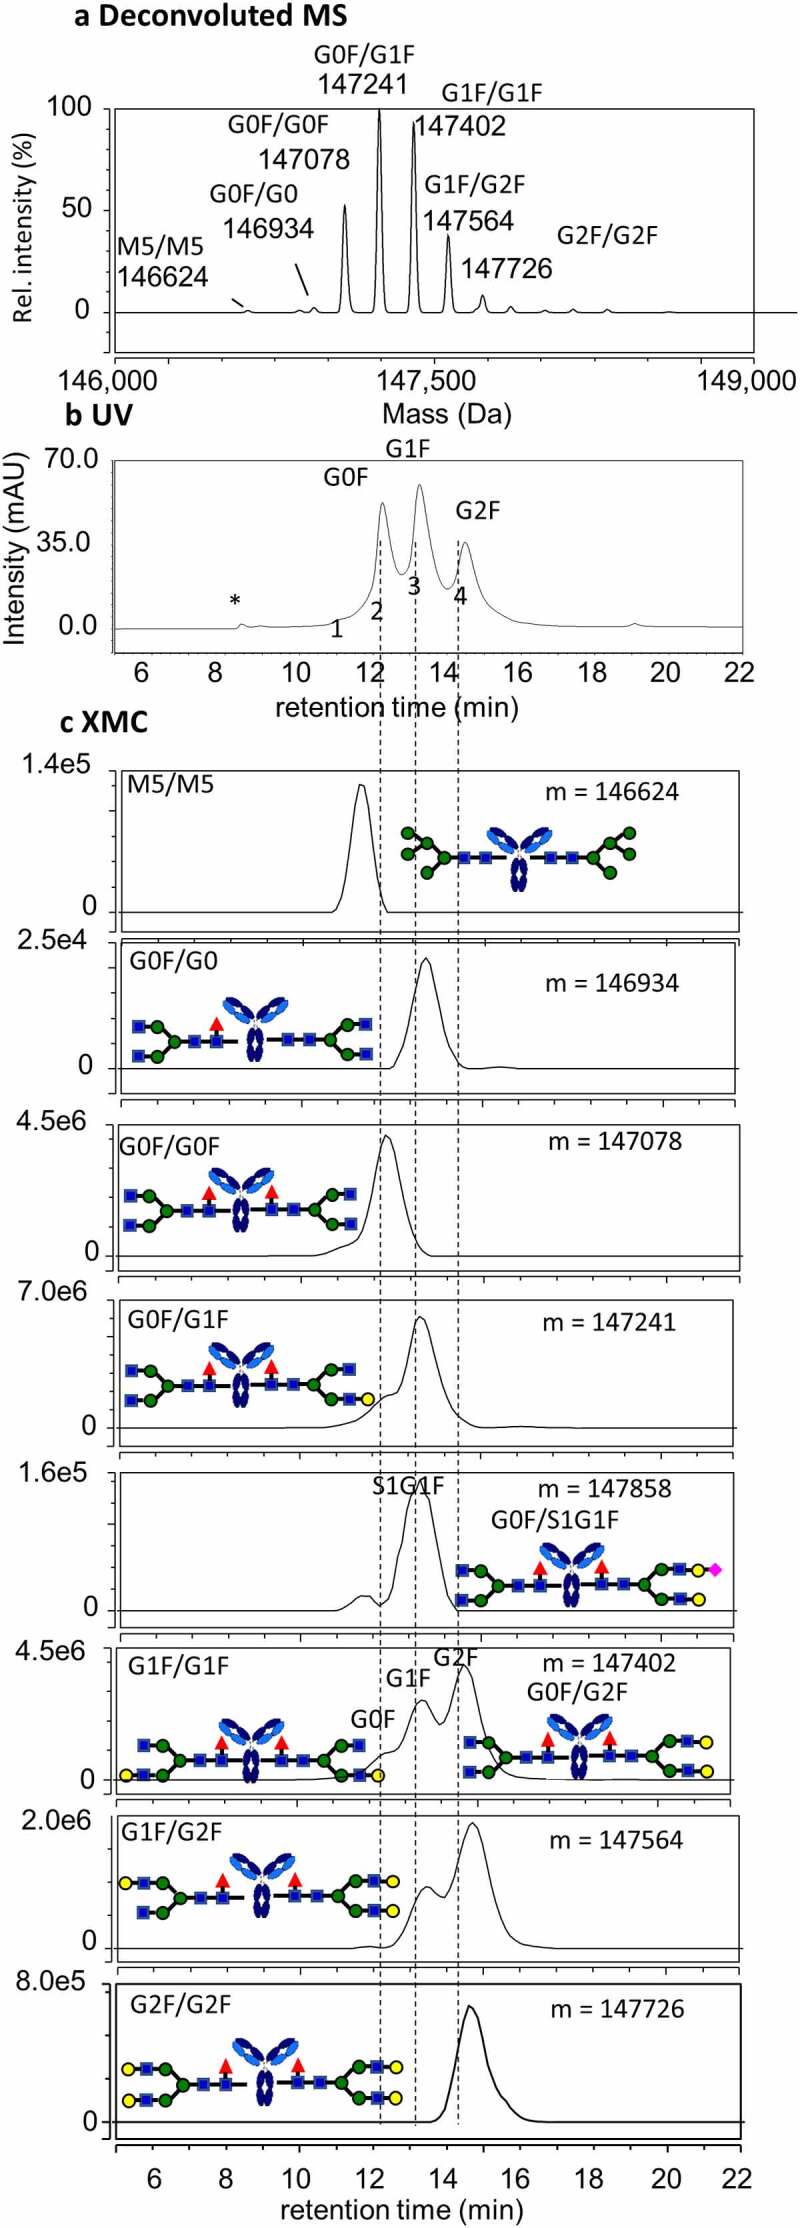
Figure 2.

FcγRIIIa affinity LC-UV-MS characterization of rituximab. (a) Deconvoluted mass spectrum of entire sample; (b) LC chromatogram with UV detection at 280 nm. Asterisk indicates elution of truncated single antenna (A1G0F) species. (c) Extracted mass chromatograms (XMC) for individual intact antibody molecules with M5/M5, G0F/G0F, G0F/G1F, G1F/G1F, G1F/G2F, and G2F/G2F glycans
