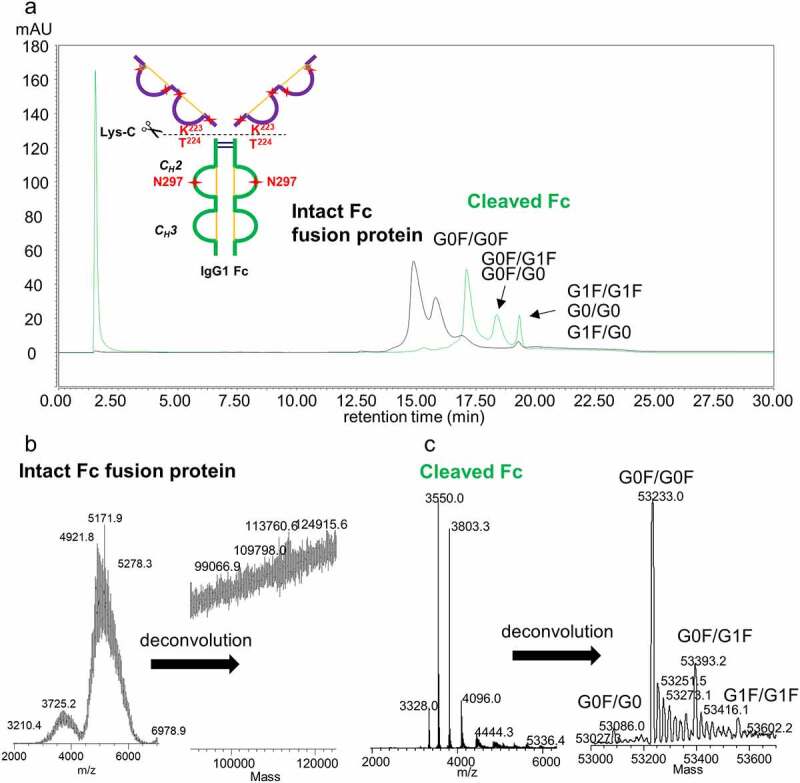
Figure 3.

FcγRIIIa affinity chromatogram with (a) UV detection and (b) and (c) mass spectrometric detection of heavily glycosylated protein conjugated to IgG1 Fc (Fc-fusion protein 2). (a) Fc-fusion protein 2 analyzed as intact and cleaved by limited proteolysis with Lys-C endopeptidase. (b) Electrospray ionization (ESI) mass spectrum of intact Fc-fusion protein 2 (left) and deconvoluted mass spectrum (right). (c) ESI mass spectrum of Fc region generated by the limited proteolysis (left) and deconvoluted mass spectrum (right)
