
Figure 5.
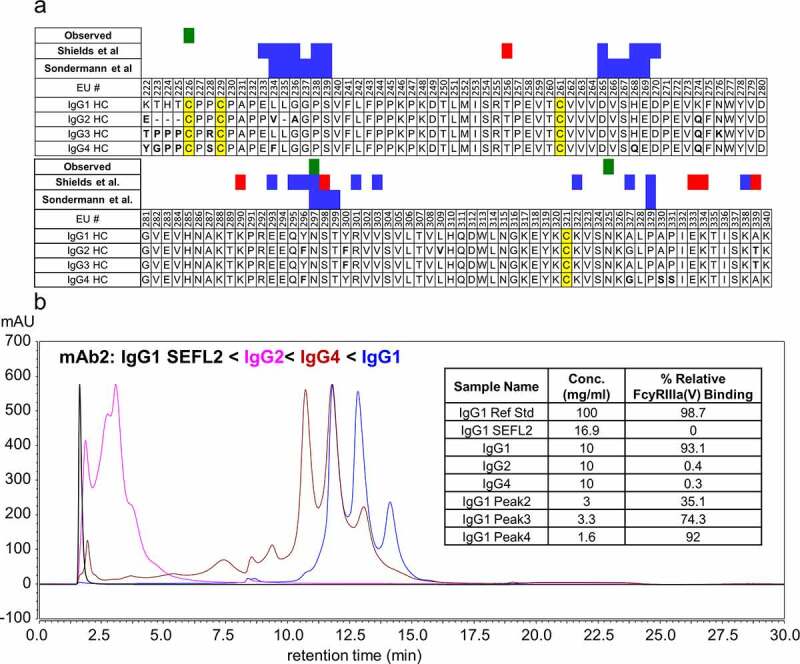
(a) Aligned sequences of CH2 region of human IgG heavy chains (EU numbering system). IgG Fc residues involved in FcγRIIIa binding are highlighted in green (measured experimentally in this study) and blue and red (reported in literature), and disulfide bonds are highlighted in yellow. Residues that differ from the IgG1 sequence are indicated in bold. (b) UV chromatogram (λ = 280 nm) of four variants of mAb2 having identical Fab regions and differing Fc regions corresponding to IgG1 (blue), IgG2 (magenta), IgG4 (maroon), and IgG1 SEFL2 with N297G mutation (black). The inset shows relative FcγRIIIa binding affinity values from AlphaLISA measurements. Affinity is measured relative to the IgG1 variant of mAb2 reference standard material