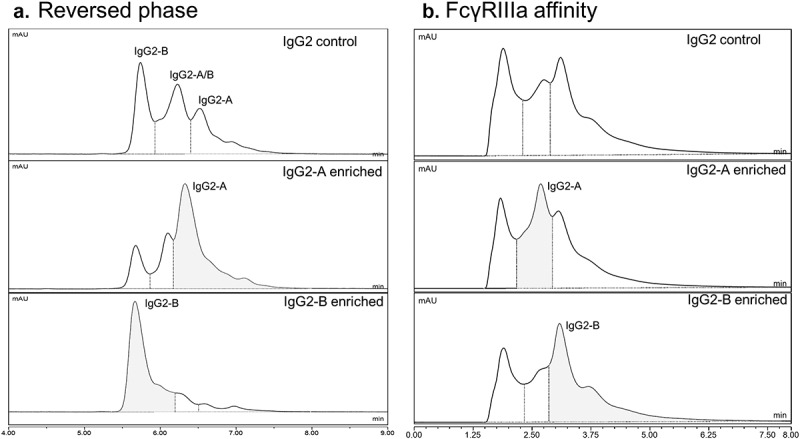
Figure 6.

(a) Reversed-phase chromatograms with UV detection at 280 nm showing separation of a mixture of naturally occurring IgG2 disulfide variants and purified samples enriched for IgG2-A and IgG2-B. (b) FcγRIIIa affinity UV chromatograms of the same samples showing partial resolution of IgG2 disulfide isoforms. Mass spectra of the peak between 1–2 min contained relatively small abundance of protein ions, suggesting that the peak may be due to light scattering on the earlier eluting formulation excipients (sucrose, polysorbate) with different refractive indexes
