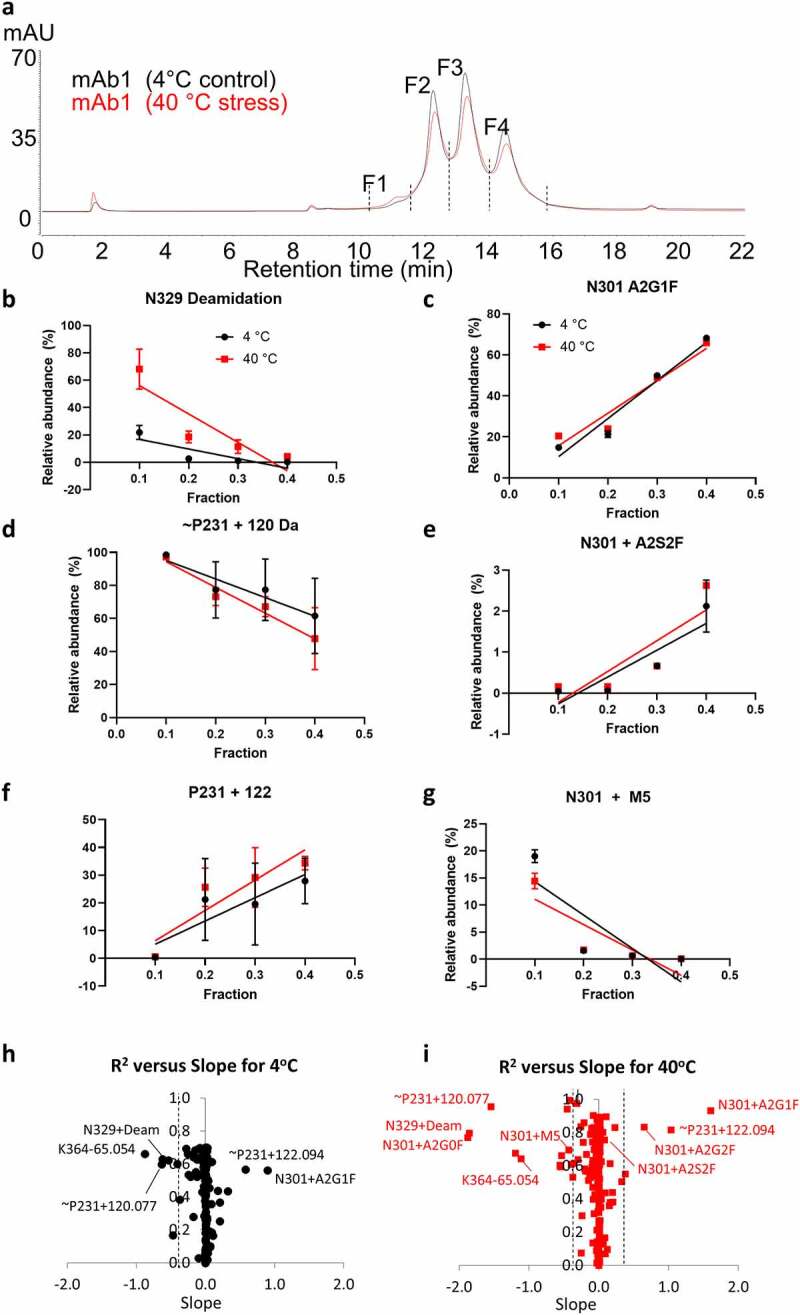
Figure 7.

(a) Affinity UV chromatograms highlighting changes in peak intensities of mAb1 following heat stress at 40°C for 6 weeks (red trace) relative to 4°C control sample (black trace). (b–g) Changes in relative abundance of selected modifications in FcγRIII affinity fractions F1, F2, F3, and F4. (h, i) R squared versus slope of change for modifications percentages in the fractions for 4°C. R squared versus slope determined from linear regressions of all detected modifications in the fractions. In all panels, red color indicates heat-stressed samples (40°C, 6 weeks) and black indicates the 4°C control samples
