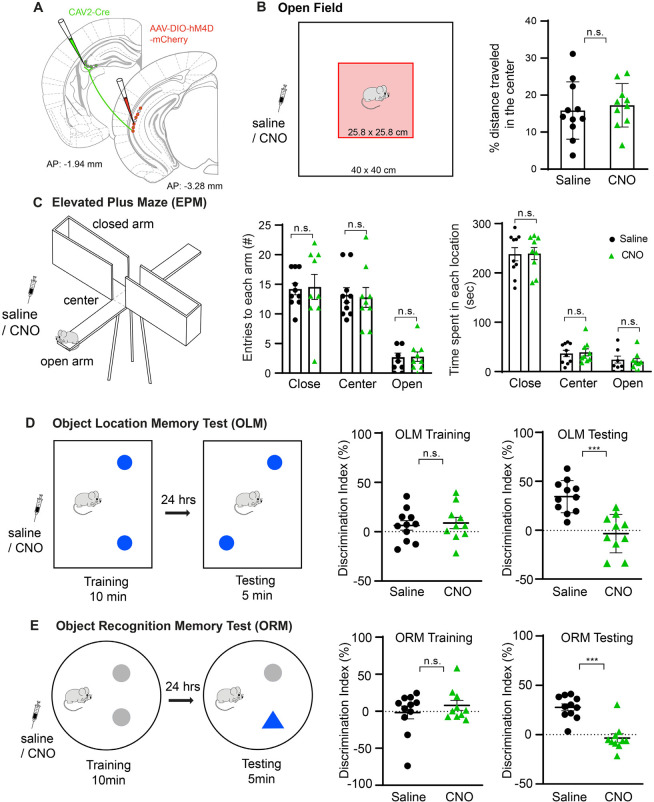
Fig 7. Genetic inactivation of the projection of vCA1 to dCA3 impairs object-related spatial learning and memory but does not modulate anxiety-related behaviors.
(A) Schematic illustration of our strategy for genetic inactivation of dCA3-projecting vCA1 neurons with a bilateral injection of retrograde transporting CAV2-Cre in dCA3 and AAV2-DIO-hM4D-mCherry in vCA1. (B) Left, Illustration of the open field test. The box represents a locomotion test chamber (40 cm × 40 cm), and the pink shaded area depicts the center zone (25.8 cm × 25.8 cm). CNO was administered by intraperitoneal injection (5 mg/kg) to experimental mice 30 minutes before testing, while the control group was injected with saline 30 minutes before testing. Right, percent distance that mice traveled in the center zone over the total distance they traveled in the open field chamber in 10 minutes (n = 11 mice for saline, n = 10 mice for CNO treatment). The group average data are represented mean ± SE. Control saline and CNO treated mice do not show significant differences in their traveling distance in the center zone relative to the open field (no significance, n.s., p = 0.467, Mann–Whitney U test). (C) Schematic illustration of the EPM test and experimental results following the CNO/hM4D-inactivation of dCA3-projecting vCA1 neurons. Left, the EPM apparatus consists of 2 open and 2 closed arms (25 cm × 5 cm) with a height of 50 cm from the ground. Mice were initially placed in the center facing an open arm, and they were allowed to explore for 5 minutes. Middle, the numbers of entries to closed arms, open arms, and center location were measured. They do not differ between control saline and CNO injection (n = 10 mice for control, n = 9 mice for CNO; closed arm, p = 0.701; center, p = 0.795; open arm, p = 0.921, Mann–Whitney U tests). Right, plots of times that mice spent in each location (n.s., closed arm: p = 0.986; center: p = 0.983; open arm, p = 0.888, Mann–Whitney U tests). The group average data are represented mean ± SE. (D) Illustration of the OLM test, and experimental results with the CNO/hM4D-inactivation of dCA3-projecting vCA1 neurons. Left, the box (23 cm × 30 cm) represents the arena for the OLM test with 2 identical objects in the training and testing sessions. The objects (indicated by blue-filled circles) are placed in the arena in the training session, and 24 hours later, one of the 2 objects is moved to a new location in the testing session. The animals were injected with CNO (n = 10 mice) or saline (n = 11 mice) 30 minutes before the training session and allowed to explore the objects in the box for 10 minutes. Middle, the mice do not differ in their overall DI measurements for the training session (n.s., p = 0.905, Mann–Whitney U test). Right, the DI measurements for the testing session at 24 hours after training differ between groups. ***, p = 0.0001 (Mann–Whitney U test). The group average data are represented as mean ± SE. (E) Illustration of the novel ORM test and experimental results. Two identical objects (indicated by gray-filled circles) are placed in the arena in the training session, and 24 hours later, one of the objects is replaced with a new object indicated by a blue, filled triangle at the same location in the testing session. Middle, the DI measurements for the training session (n.s., p = 0.973, Mann–Whitney U test). Right, the DI measurements for the testing session differ significantly between groups. ***, p = 0.003 (Mann–Whitney U test). The group average data are represented mean ± SE. The raw data for Fig 7B–7E are included in S3 Data. CNO, clozapine N-oxide; dCA3, dorsal CA3; DI, discrimination index; EPM, elevated plus maze; OLM, object location memory; ORM, object recognition memory; vCA1, ventral CA1.

