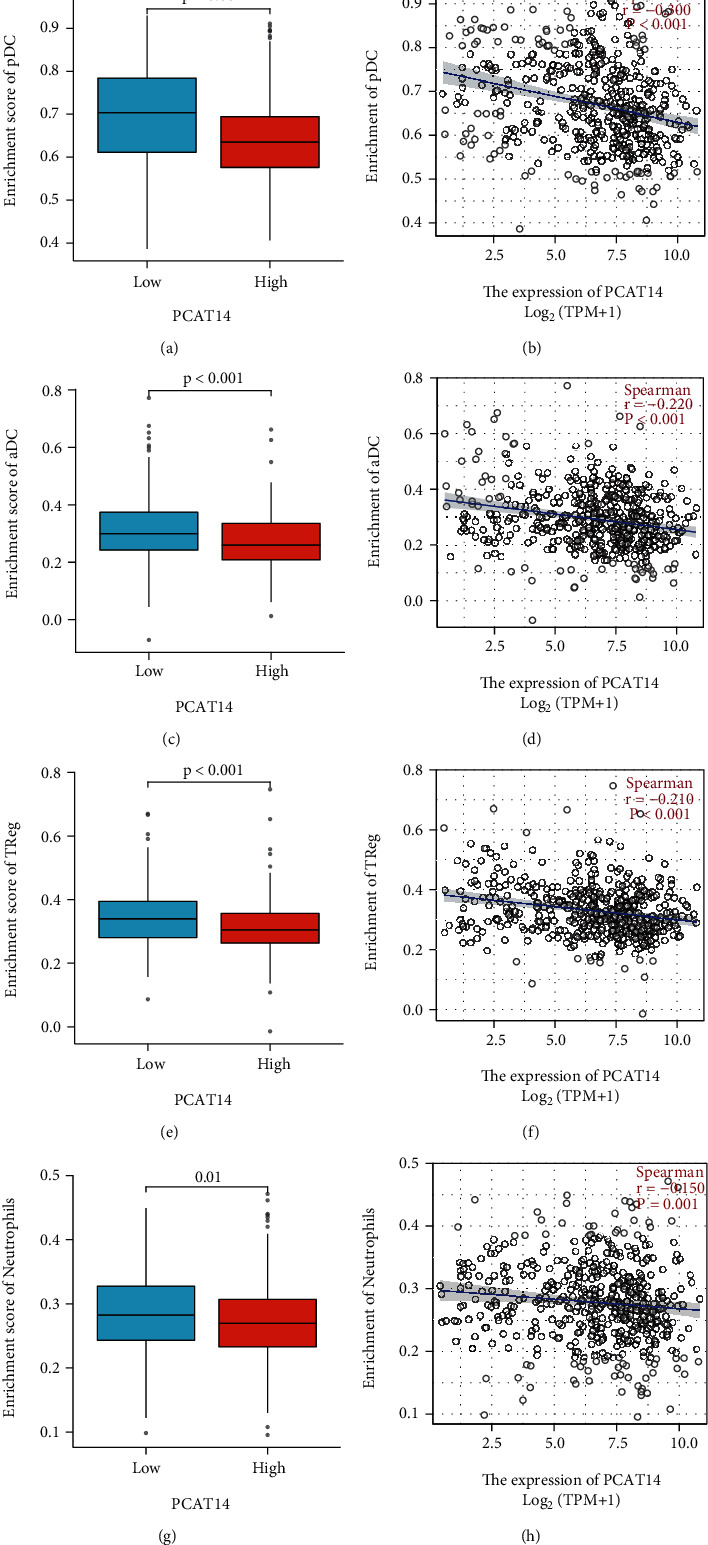
Figure 4.

Correlation analysis of PCAT14 expression level with pDC, aDC, Treg, and neutrophil infiltration. (a) The Wilcoxon rank-sum test analysis showed that the plasmacytoid dendritic cell (pDC) infiltration level of the high PCAT14 expression group was low, and the pDC infiltration level of the low PCAT14 expression group was high, and the difference was statistically significant. (b) The Spearman correlation analysis showed that the expression level of PCAT14 was negatively correlated with the infiltration of pDC. (c) The Wilcoxon rank-sum test analysis showed that the activated dendritic cells (aDC) infiltration level in the high PCAT14 expression group was low, and the aDC infiltration level in the low PCAT14 expression group was high, and the difference was statistically significant. (d) The Spearman correlation analysis showed that the expression level of PCAT14 was negatively correlated with the infiltration of aDC. (e) The Wilcoxon rank-sum test analysis showed that the level of regulatory T cell (Treg) infiltration in the high PCAT14 expression group was low, the Treg infiltration level in the low PCAT14 expression group was high, and the difference was statistically significant. (f) The Spearman correlation analysis showed that the expression level of PCAT14 was negatively correlated with Treg infiltration. (g) The Wilcoxon rank-sum test analysis showed that the level of neutrophil infiltration in the high PCAT14 expression group was low, the neutrophil infiltration level in the low PCAT14 expression group was high, and the difference was statistically significant. (h) The Spearman correlation analysis showed that the expression level of PCAT14 was negatively correlated with the infiltration of neutrophils.
