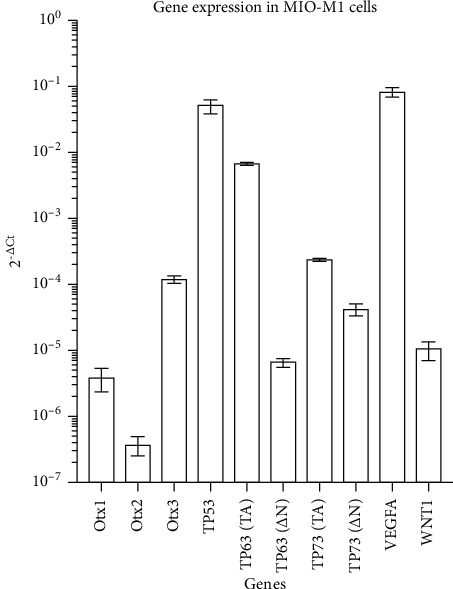
Figure 4.

Molecular characterization of gene expression in untreated MIO-M1 cells. Each gene was normalized to β-actin expression level, to obtain a value representing the fold change between the two analyzed genes. On the Y-axis, the fold change value is reported. Each value is indicated as median ± SD.
