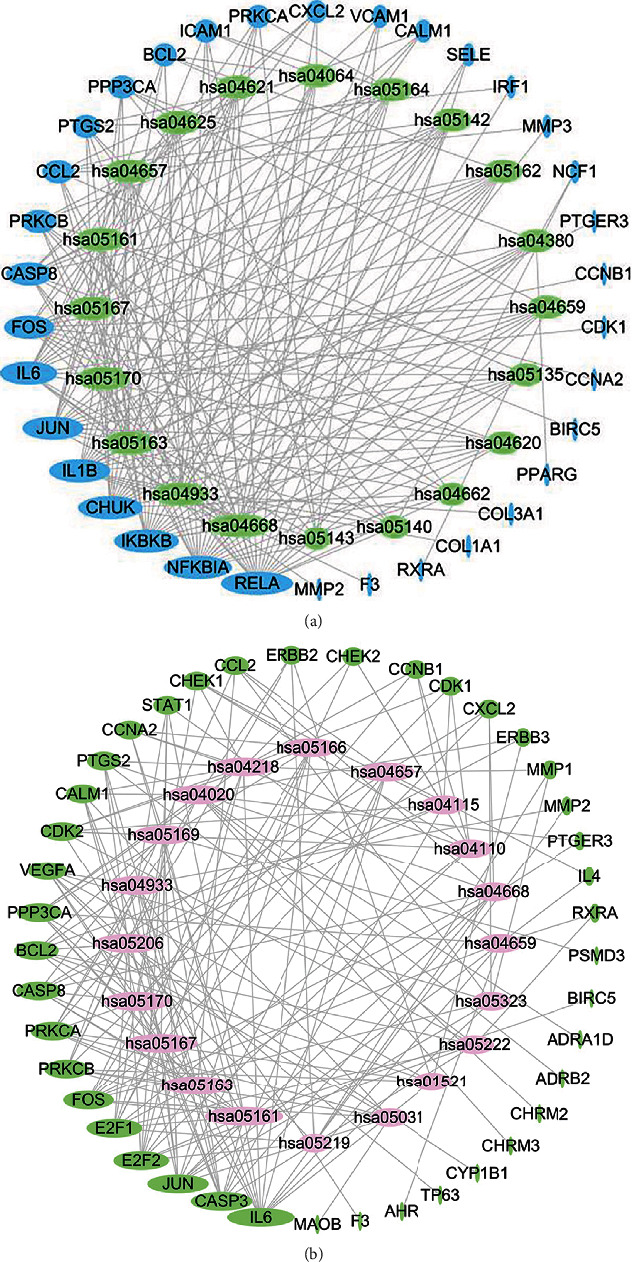
Figure 6.

ZLJSD gene-pathway network against BLCA. (a) In noninvasive BLCA, a topological study of 20 pathways and 34 genes was performed using betweenness centrality. Target genes are shown by blue ellipses, and pathways are represented by green ellipses. (b) Invasive BLCA performed a topological study of 20 pathways and 41 genes using betweenness centrality. The pink ellipses reflect pathways, whereas the green ellipses indicate target genes. The higher the size, the greater the centrality betweenness.
