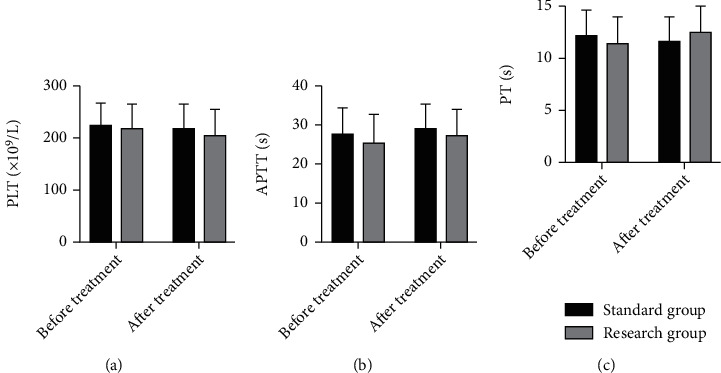
Figure 1.

Comparison of coagulation function between the two groups. (a) Comparison of PLT levels between the two groups before and after treatment. (b) Comparison of APTT levels between the two groups before and after treatment. (c) Comparison of PT levels between the two groups before and after treatment. APTT: activated partial thromboplastin time; PT: partial prothrombin time; PLT: platelet.
