
Figure 6.
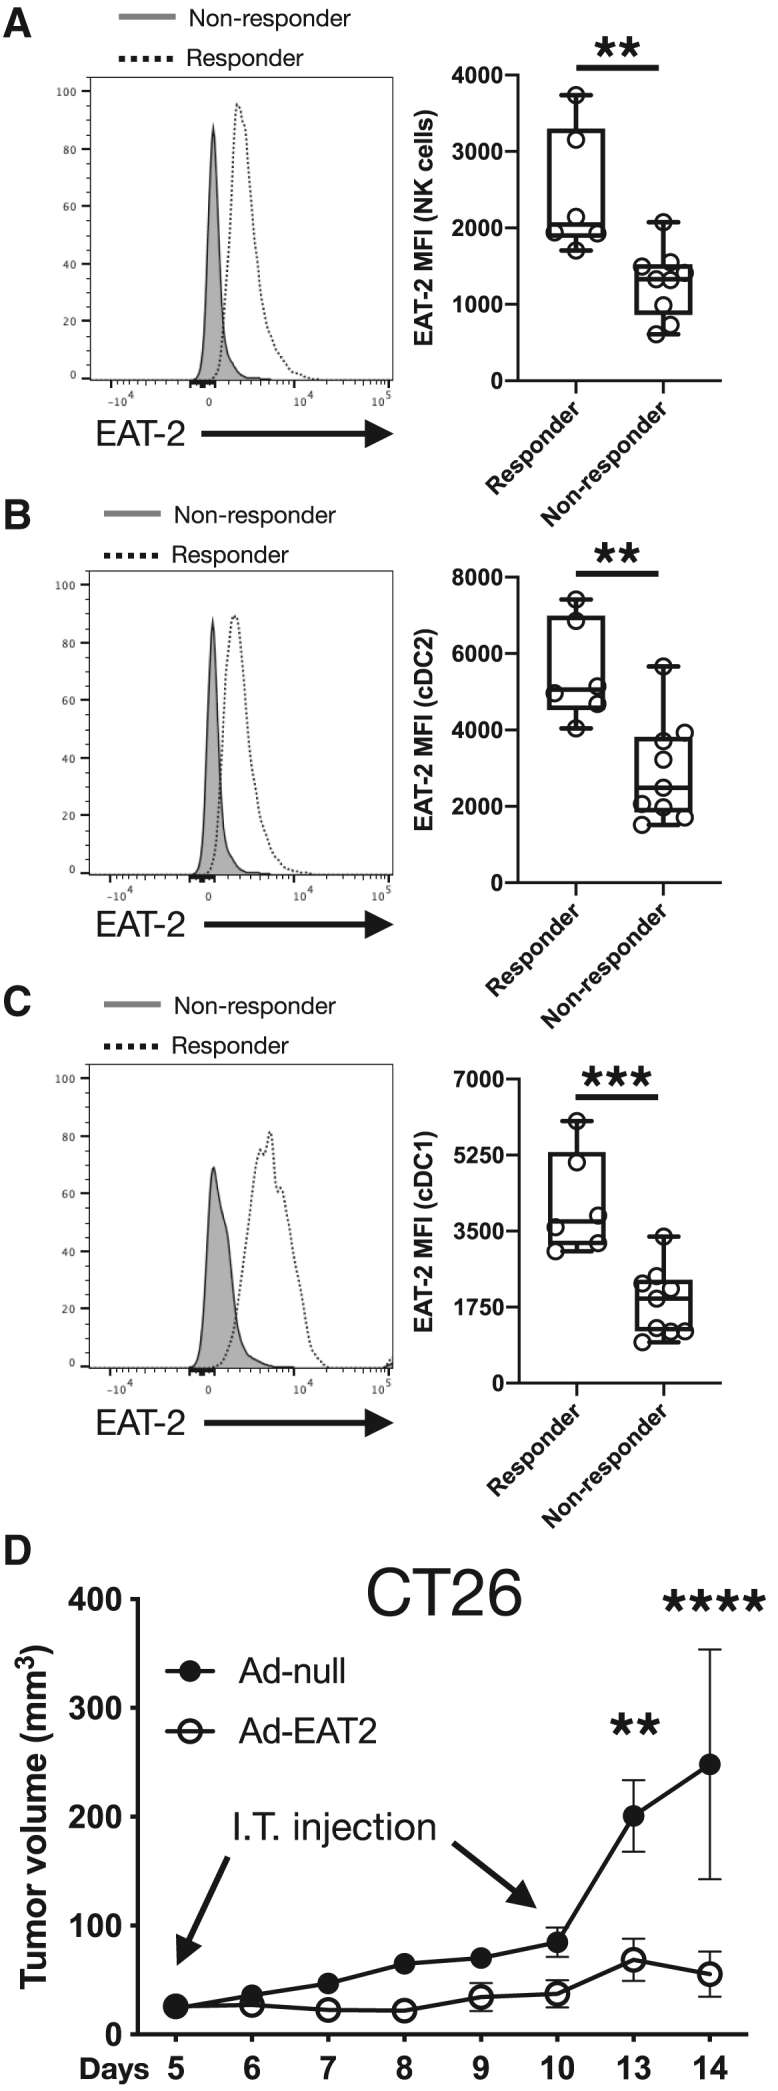
EAT-2 expression in immune cells from adenovirus treated B16 tumors as an indicator of response to treatment
(A) Expression of EAT-2 in B16 tumor-infiltrating NK cells from tumors treated with adenovirus. (B) Expression of EAT-2 in B16 tumor-infiltrating cDC2 cells from tumors treated with adenovirus. (C) Expression of EAT-2 in B16 tumor-infiltrating cDC1 cells from tumors treated with adenovirus. (D) Tumor volumes of CT26 tumors treated I.T. twice with 1 × 10¹⁰ v.p. of either Ad-null or Ad-EAT-2. All data are presented as mean ± standard error of the mean and representative of a single experiment. Two-way ANOVA with Tukey's multiple comparison test used to compare groups in (D). An unpaired, two-tailed t test was used to compare groups in (A–C). ∗∗p < 0.01; ∗∗∗p < 0.001; ∗∗∗∗p < 0.0001.