
Fig. 2.
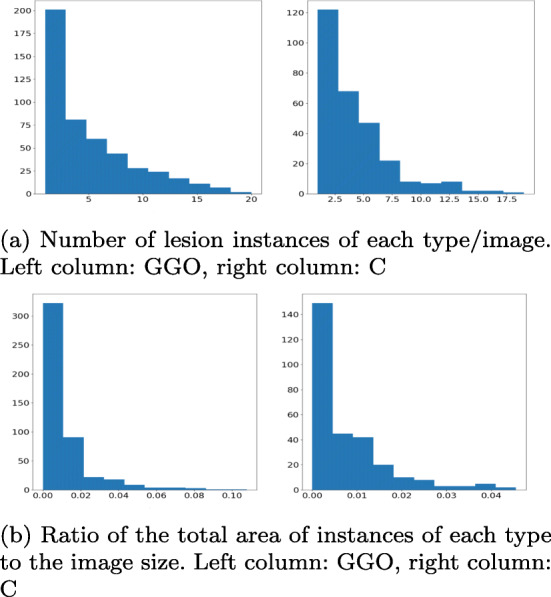
Distribution of the COVID-19 correlates in the segmentation data. The absolute majority of images have a small number (< 5 occurrences of each type) and the absolute majority of them are very small: GGO are < 2% of the image size and C are < 1%. This means that CT scans contain mostly a small number of small lesion occurrences