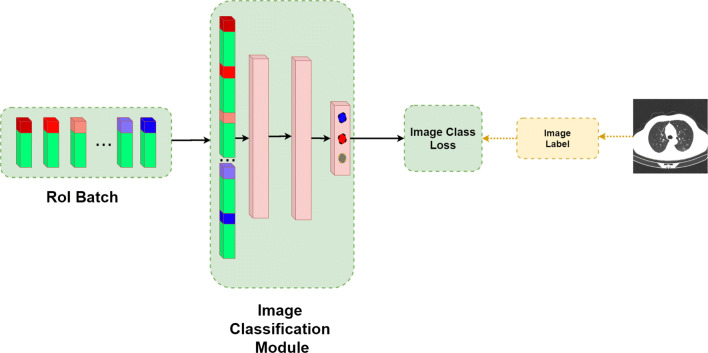
Fig. 5.
Batch output from RoI layer and image classification module S of COVID-CT-Mask-Net: RoI batch is reshaped from N × 5 to a feature vector size 1 × N ⋅ 5 by concatenating the encoded boxes (green) and their scores(red, blue), followed by two fully connected layers, and the last prediction layer outputting 3 logits (scores), 1 per image class. The colors in each element reflect the normalized (sigmoid) confidence score (red:high, blue:low). Best viewed in color

