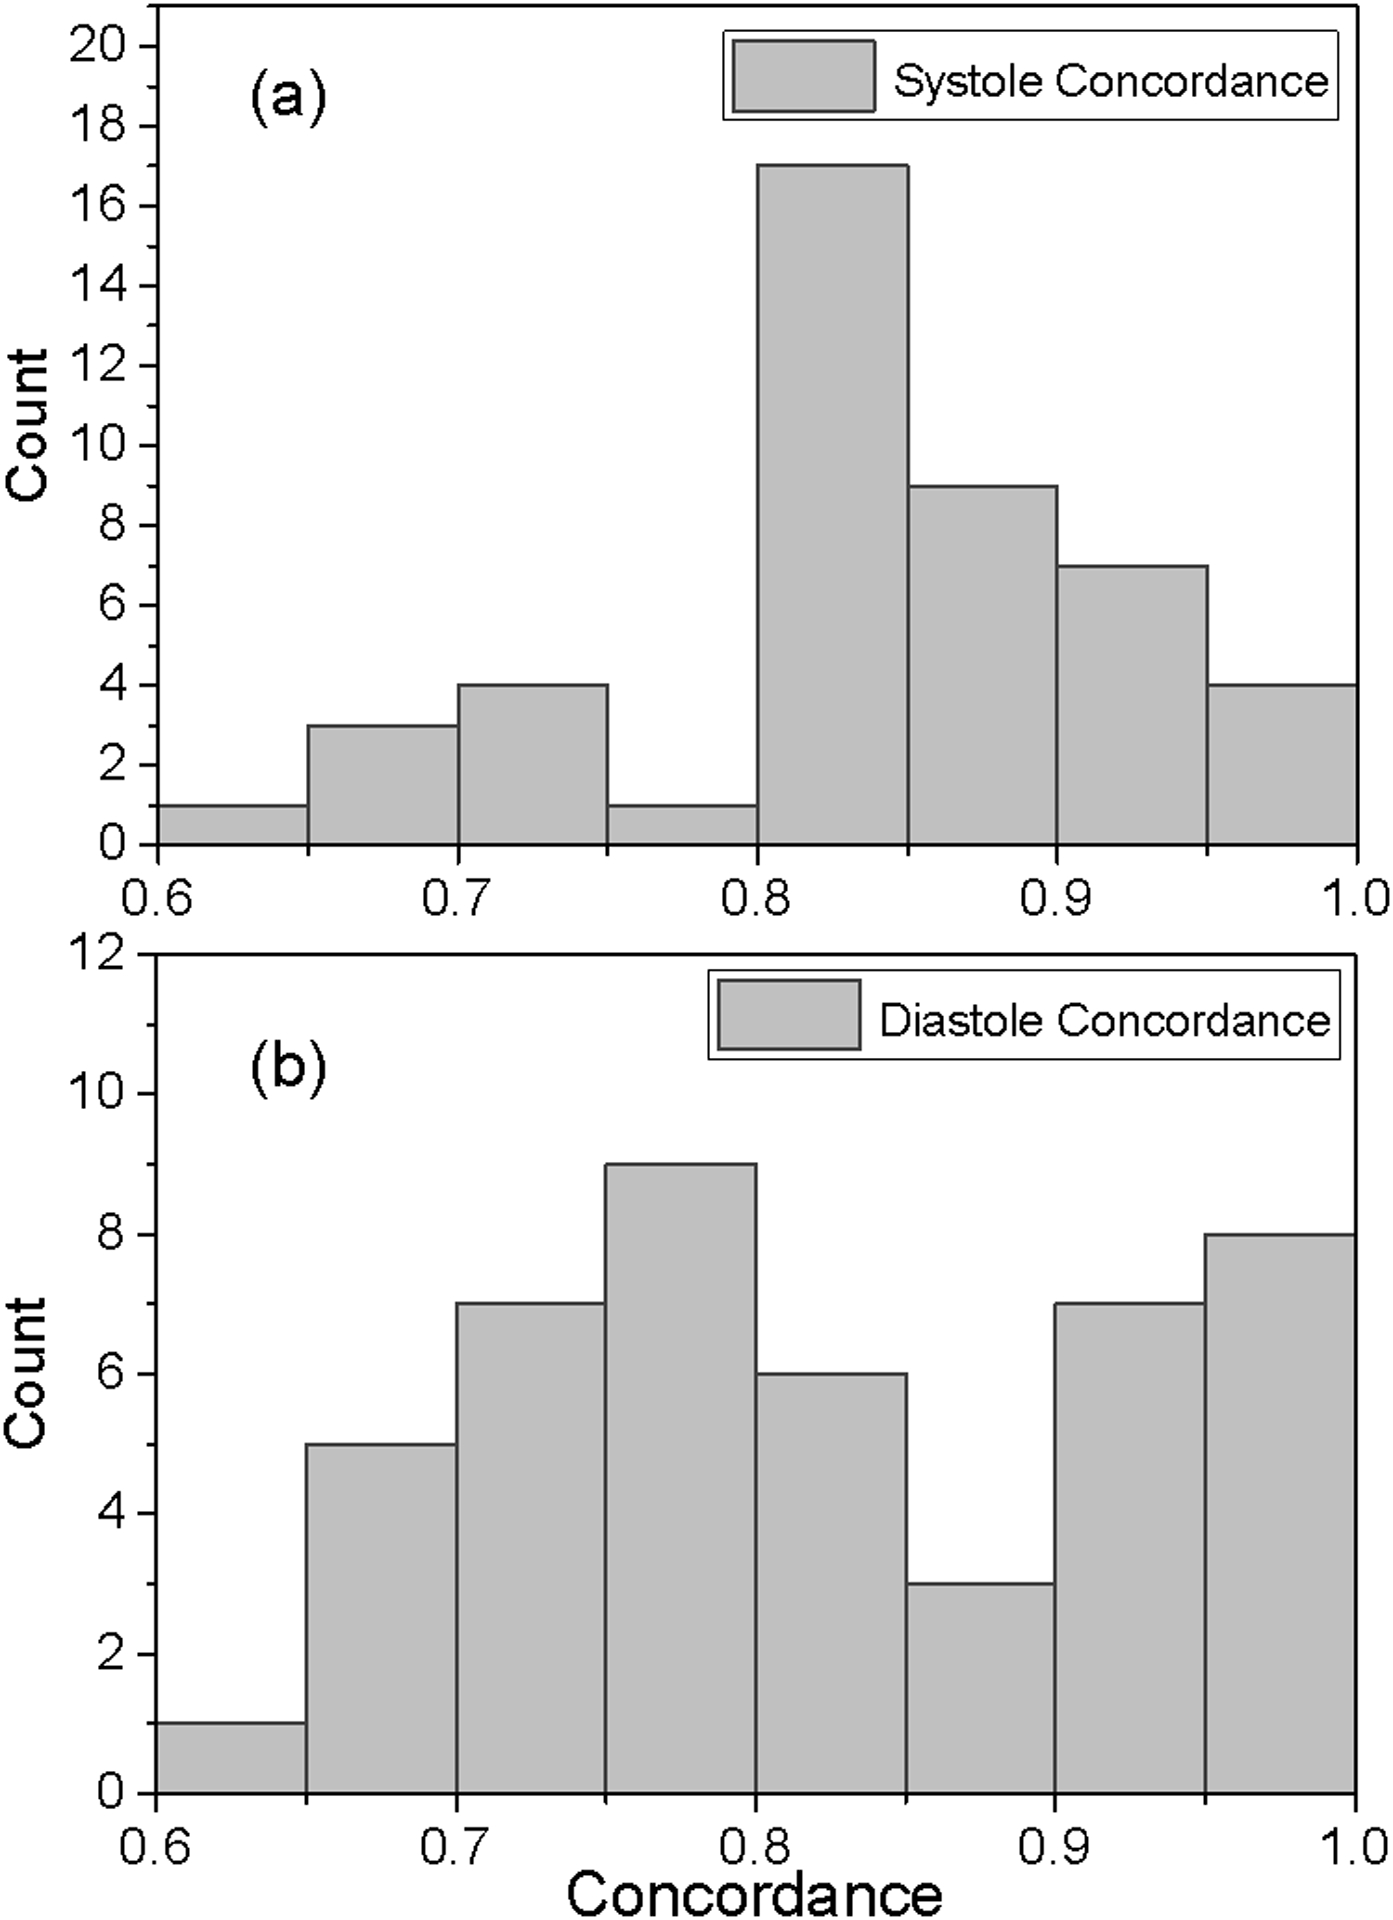
Figure 4.

Distributions of the patient concordances for systole (a) and diastole (b). As an example, 17 patients had systolic concordances between 0.80 and 0.85, while only one patient had a systolic concordance between 0.75 and 0.80. The mean for the systolic concordance distribution is 0.83 (SD 0.08) while the corresponding measures for diastole are 0.82 (0.102).
