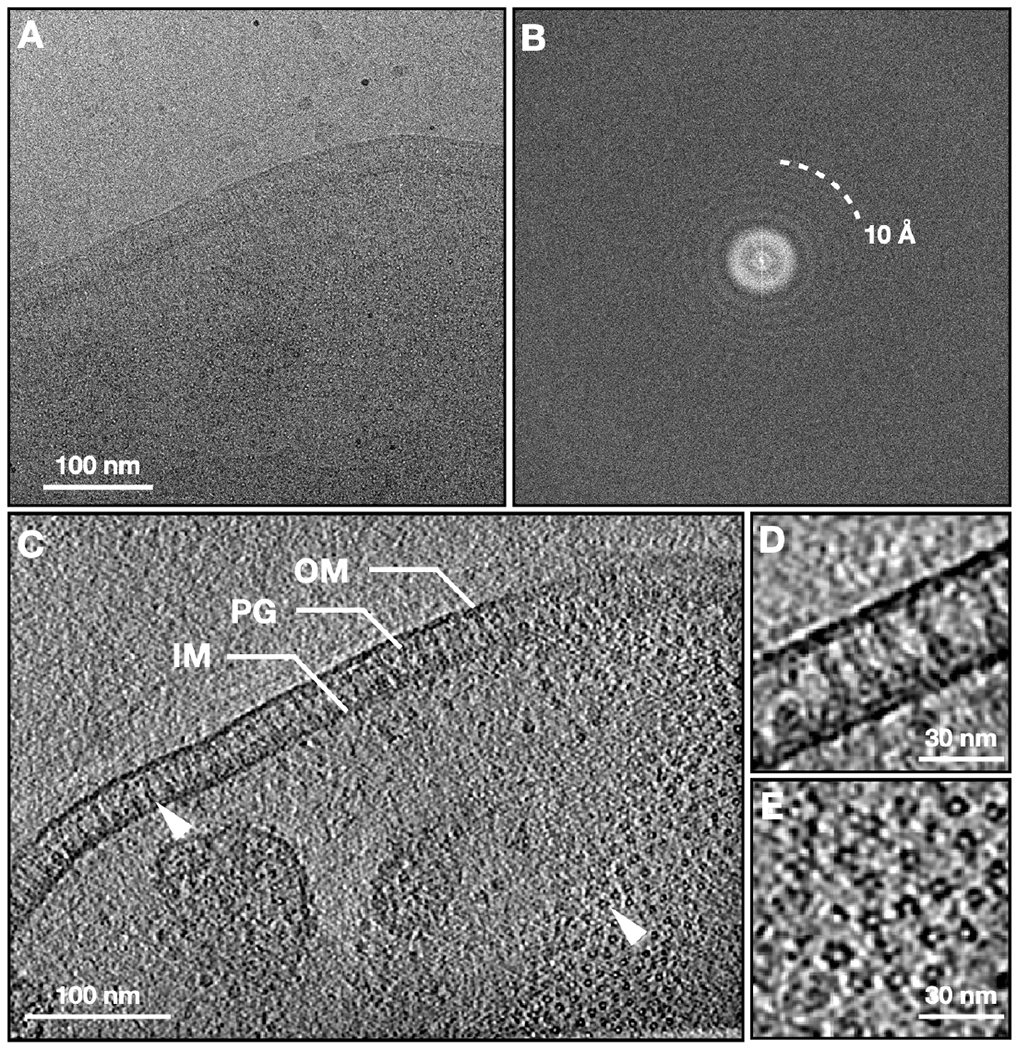
Figure 1. Cryo-ET of E. coli expressing the AcrAB-TolC multidrug efflux pump.

(A) Zero-degree tilt image of a representative tilt series. (B) Fourier transform of (A). (C) Slice view of the reconstructed tomogram, with arrowheads showing the side and top view particles. (D, E) Zoomed in view of the side and top view particles. OM, outer membrane; IM, inner membrane; PG, peptidoglycan.
