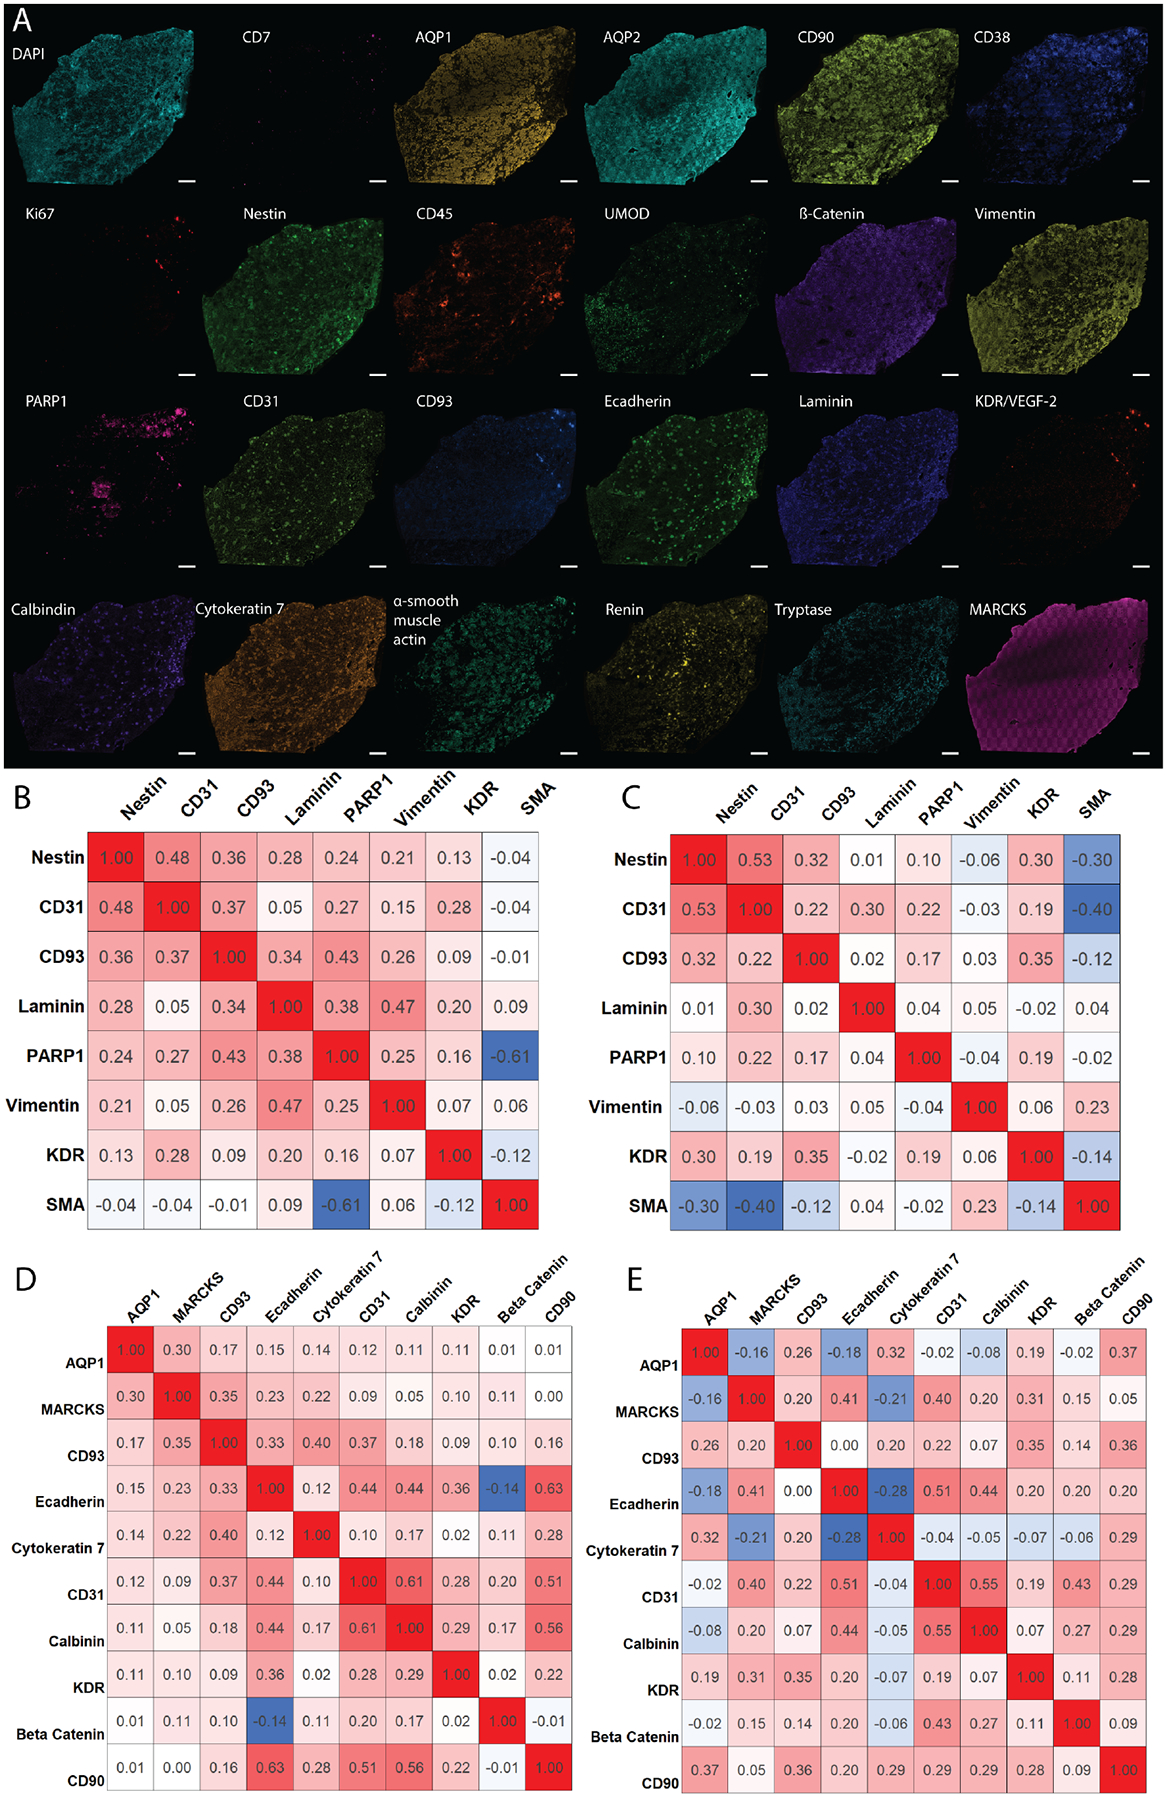
Figure 2:

A) Individual images of assayed antigens showing the diversity of structures within the kidney. B) Pearson’s correlation coefficients from three healthy kidney samples for glomerular markers, indicating cell types that are highly correlated (red), noncorrelated (white), and anti-correlated (blue). C) Correlation plot derived from three diabetic nephropathy kidneys, showing cellular redistribution resulting from disease. D) Similar correlation plot for tubular markers from healthy and E) diabetic nephropathy patients. Correlations were established between 0 and 40 μm from the center of the cell for the entire tissue and consist of ~1 million cells.
